(This was originally posted in April of 2017 to various internet locations)
Roughly two years ago, I posted here an analysis of NCAA tournament data that confirmed what we all already knew: Tom Izzo is the best tournament coach of all time. Yes, other coaches may have more Final Fours and more titles, but when it comes to performance relative to expectation, Izzo is the best. Two years ago, just after MSU's magical run to the Final Four in 2015, I presented data that calculated the numbers wins for each coach over what would be expected based on that coach's seed each year. At the time, I thought that I had created something new, but through the comments it became rapidly apparent that this type of statistic already existed under the name of PASE (Performance Against Seed Expectation) at least as far back as 2008 when ESPN explained it, and writers such as our own Nate Silver have written on it more recently.
The math behind my metric is slightly different than PASE, as the PASE metric considers the performance of each team per tournament, while my metric considers each tournament game individually. For example, based on the historical data since the 64 team expansion in 1985, 1-seeds win, on average, 3.36 games per tournament. So, if a 1-seed wins 5 games (makes the title game), that team won 1.64 more games than average, so that team has a PASE of 1.64 for that tournament. In my metrics, I instead use the expected value of wins for any given game. For example, 1-seeds win 80% of all of their tournament games (444-112 since 1985). In other words, the expected value of wins per game for a 1-seed overall is 0.80. Mathematically, for each game a 1-seed wins, that team gets 0.2 "points" (1 minus the expected value) and for every game a 1-seed loses, that team loses 0.8 "points". For example, if a team has played 10 games total as a 1-seed, but only won 7 of those games, their score is -1.0 (7*0.2 - 3*0.8 = -1), but if they won 9 of 10, their score is +1.0 (9*0.2 - 1*0.8=1). Got it?
My expected-value-based metrics are highly correlated to PASE, but my metrics are a bit more conservative. They punish a team less for getting upset than PASE does and generally rewards a team less for a deep run. My metrics also have some mathematical advantages such as the total sum for all 606 coaches to have made an appearance in March Madness since seeding began in 1979 is exactly zero, as is the sum for all 1-seeds, etc. Part of the reason for this is that my expected-value metrics tacitly assume that the total tournament games played by each coach is fixed, while PASE takes into account the loss of potential wins down the road. For example, MSU’s loss to MTSU last year resulted in a PASE "penalty" of -2.37 due to the loss of potential 2nd and 3rd round wins which a 2-seed is favored to win. In the expected-value-based system, a team can never be penalized more than one game per tournament. So, they measure slightly different things.
When I made my original post in 2015, I presented two metrics, one of which was based on the overall winning percentage of each seed overall. For example, as stated above, 1-seeds win 80% of all of their tournament games. While this is true, they obviously have won 100% of all 1st round games and the win percentage goes down to only 60% from the Regional Final on. Considering this fact, I modified this metric this year to instead consider the winning percentage / expected value of each seed as a function of round. For examples, 1-seeds have an expected value of 1.0 wins in 1st round games, 0.85 in 2nd round games, 0.8 in 3rd round games, and roughly 0.6 in the regional final on. Since all metrics need to have snappy acronyms, I call this metric the Performance Against Round Independent Seed (PARIS) and its value is essentially the number of wins above or below average compared to all other coaches. The R-squared correlation to PASE is 0.93, so they give very similar results, although PASE is almost always larger in value.
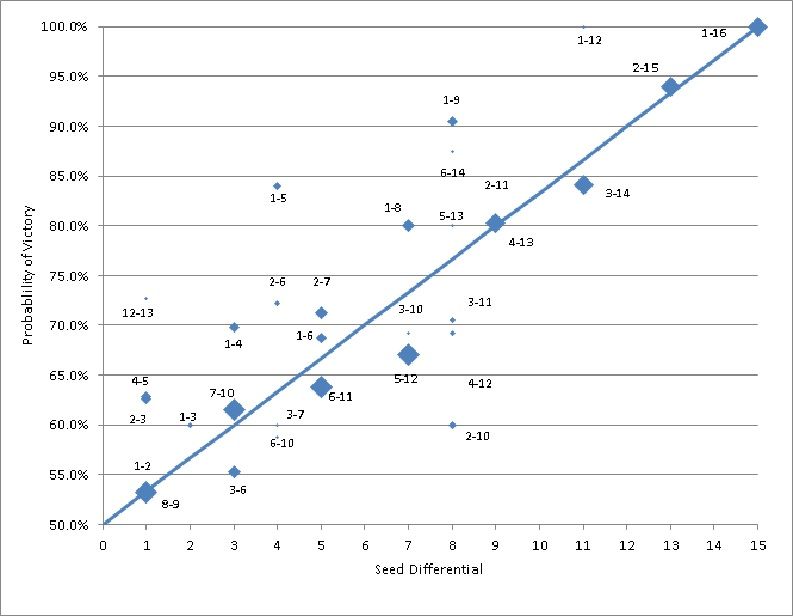
The second metric I developed is mathematically similar to PARIS, but it takes into consideration one additional factor, and that is the idea that not all tournament paths are created equally. For example, in 2000, MSU as a 1-seed faced the toughest possible path to the Final Four in playing a 16-seed, 8-seed, 4-seed, and a 2-seed while in 2001, MSU made the Final Four by beating a 16-seed, 9-seed, 12-seed, and an 11-seed. The PASE and PARIS metric would treat each of these tournament runs equally. However, in my opinion, you can more accurately account for this "luck of the draw" by considering the expected value of each game based on the differential in seed between the two teams. For example, a 1-seed playing a 4-seed has a differential of 3, while a 1-seed playing a 12-seed has a differential of 11. As I observed a few years ago, if you plot the probability of victory (i.e. the expected value) for all games in the tournament vs. seed differential, the plot is surprisingly linear (see below), although there are some noticeable biases, specifically, 1-seeds always do a little better than the full regression would suggest.

In my original metric in 2015, I simply used the linear fit, but through advances in my spreadsheet database, I have updated the metric to instead consider the exact expected value of all possible seed combination based on historical tournament data. I call this metric the Performance Against seed Differential (PAD) Of course, you can get into trouble with small sample sizes (such as the odd fact that 2-seeds are only 1-4 against 5-seeds), but in general I assume that the largeness of the overall dataset will make these anomalies even out. Finally, I also find it useful to tabulate formally the actual cumulative deviation from the seed that a team should face along their tournament path relative to chalk. I call this factor, LOTD (Luck of the Draw). For example, for MSU’s pre-Final Four run in 2000, the LOTD was zero (not at all lucky), but in 2001, is was 18 (very, very lucky).
Moving forward I now present the PASE, PARIS, and PAD data for coaches back to 1979. PASE is the established metric, so I want to show that for reference to the work of others, PAD is what I think is most useful, and PARIS is a kind of bridge between the two: it is mathematically similar to PAD but philosophically similar to PASE. Plotting the three metrics for all 606 coaches is a bit unwieldy. The full histogram looks, not surprisingly, like a bell curve (see bottom right panel below), as the vast majority of coaches have only made a handful of tournament appearances. So, in order to make things a bit easier to interpret, I have only plotted the metrics for the 128 coaches who have played at least 10 tournament games. Finally, for each of the four metrics in my study (PASE, PARIS, PAD) I plotted both the total cumulative value of each metric as well as the per tournament value. So, enough of all that, it is time to UNLEASH THE HISTOGRAMS:


1) Tom Izzo is still the Master of March: As the charts show, Izzo is the currently leader in all three cumulative metrics. More than that, Izzo’s current PAD of 8.09 is higher than any other coach at any other time in history with the sole exception of Denny Crum in 1997 when he hit 8.68 with Louisville. Izzo’s per year stats are not quite as elite, but he is still in the Top 10 in these metrics and the vast majority of coaches ahead of him benefited from generally small samples sizes as well as a bit of luck. A quick look at some of Izzo’s other stats shows the reasons why his scores are so high. He is over 0.500 as an underdog in the tournament and holds the record for wins as an underdog with 14. The next best coaches only have 11 (Massimino, Olson, and Boeheim). Izzo also rarely gets upset (only 6 times) and thus has won just a shade below 85% of his games as a favorite (good enough for 7th place among coaches with 10 or more tournaments). Izzo has also made the Sweet 16 in 65% of his tournament appearances and the Final Four in 35%, which is second only to Coach K for coaches with more than 10 attempts. The only knock on Izzo, it that his performance at the Final Four is not great (only 3-6) and thus he really should have at least one if not two more titles than he has.
2) The other two active coaches in Izzo’s neighborhood are Rick Pitino and oddly, Roy Williams. Pitino may not have as many upsets as Izzo has, but he does tends to avoid upset losses, has dominated the Sweet 16 round (12-1 lifetime), and has one more title than Izzo. As for Ol’ Roy, I must admit, I have always thought he was a pretty inept x’s and o’s guy. But, the stats don’t lie. His tournament performance has been pretty damn good. He is not great as an underdog (only 5-12) but as a favorite he is rock solid (86%) and he has never lost a 1st round game in 27 tournaments, which is borderline miraculous. Even when he does lose as a favorite, it is rarely to a team seeded more than 1-2 lines below him. The recent exception? George Mason in 2006 in a 3-11 game. Remember those guys? Furthermore, he is not nearly as lucky as most other big name coaches, which is demonstrated by his relatively low LOTD score of 2.9 and this further demonstrated by his strong PAD score relative to his PARIS score. That all said, the last two years have certainly boosted Roy’s metrics. In the summer of 2015, his PAD was only 4.95, which is still very good, but not super elite.
3) The Masters of March in the 80s were Denny Crum and Rollie Massimino. Both coaches had stats that in their own way were very Izzo-like. Both were dominant as a favored seed. Crum only lost four games as a favorite, and Massimino was not upset once in ten years, which is unmatched by anyone in the modern era. Crum had 7 underdog wins, which is half as many as Izzo, but still currently good for an 8-way tie for 8th all time. Massimino had a whopping 11 upsets in only 10 years and is the only coach other than Izzo to be over 0.500 as an underdog with more than 12 games in that situation. Surprisingly, they only have 5 Final Fours between them, but they won 3 Title combined with those chances.
4) Brad Stevens, Guy Lewis, Larry Brown, and Frank Martin have great per year numbers, but they are mostly the product of small sample sizes. Guy Lewis (the coach during the Phi-Slama-Jama days at Houston) and Butler’s Brad Stevens only coached in 4 and 5 tournaments, respectively. Larry Brown has only coached in 8 tournaments. As you might expect, per year basis metrics are pretty sensitive to small sample sizes. Just as example, Frank Martin’s per-year metrics all look great this year due to South Carolina’s magical run to the Final Four as a 7-seed. But, before this year’s run, his PAD/yr value was only 0.23, which is good, but not elite. Interestingly, Stevens, Lewis, and Larry Brown were also all certainly on the lucky side, as the LOTD graph clearly indicates.
5) Speaking of lucky, Billy Donovan has great stats, but he is the luckiest coach in the history of the tournament. Over 14 seasons, he averaged a cumulative seed differential from chalk (LOTD) of over 8. That is simply astounding. The next highest value for a coach with more than 8 tournament appearances is 5.0. But, that is what happens when you benefit from a 15-seed upsetting the 2-seed in your region, twice (among other things). Billy the Kid also had a tendency to get upset, considering 9 of his 12 tournament losses were to lower seeds. But, his performance as an underdog was ironically quite good (6-3, which is the best percentage for any coach with more than 3 tournament appearances), and of course there is the fact that he won two titles.
6) John Beilein is better in March than we probably give him credit for. His cumulative metrics are all strong, and his per-year scores are also very strong. While his relatively few tournament appearances (11) is on the low side, it is impossible to deny that he has been a strong tournament coach over the years. Beilein has notably only been upset twice in his career and one of the "upsets" was to Calipari’s 8-seeded 2014 Kentucky squad that played in the title game. He also owns 7 total upset wins. In fact, he currently has slightly better per year PARIS and PAD scores than does Coach Izzo. If we consider only active coaches with more than 5 tournament appearances, Beilien and Izzo are #1 and #2 in both PARIS/yr and PAD/yr. #respect.
7) Coach K, Calipari, Jim Calhoun, and Jim Boeheim are all very good in March.These four coaches clearly seem to round out the next tier of very good coaches that have not yet been mentioned. Calipari has the best March stats of those four, with a PAD score over 4.0, relatively few upset losses (8) and a respectable number of upset wins (6). Calhoun’s metrics are quite similar. A few notable differences are that Calipari has been great in the 1st round (17-1), and has made the Regional Final in over 60% of his tournament appearances. On the other hand, he has only 1 title to show for it. Conversely, Jim Calhoun has average early round performances, but has a ridiculous 6-1 record in the Final Four, only having lost there to none other than Tom Izzo in 2009. Coach K and Jim Boeheim certainly also have good metrics, but as their metrics per year imply, a part of their success does lie in their longevity. Both get upset at a higher rate than most elite coaches (only an 80% and 75% winning percentage as favorites). Boeheim does have a lot of upset wins (11), but a remarkable small number of Final Fours (5) and Titles (1) considering he has coached in 30 tournaments. Meanwhile, Coach K has not upset a team since 1994, but those 5 Titles do help prop up his scores. That all said, Coach K’s PAD since 1992 is -2.25, which is roughly equivalent to Tony Bennett in the bottom 10% of all active coaches.
8) Notable active coaches in the slightly above average March Warrior category include: Tubby Smith, Sean Miller, Gregg Marshall, Mark Few, Bo Ryan, Jay Wright, Thad Matta, and Dana Altman. They all have PAD values between 0.0 and 2.4. Of those coaches, the one with the most luck is Bo Ryan, with a LOTD score of 4.6, while the least lucky are Jay Wright with a LOTD score of only 1.0, Dana Altman with a score of 0.8, and Gregg Marshall with a score of 0.7. Some guys just can’t catch a break.
9) The notable coaches in the below average category are Tom Crean, Matt Painter, Bob Knight, Bill Self, Lute Olson, Bob Huggins, and Mike Brey. They all have PAD values between zero and -1.5. Now, clearly this group has accomplished some things, as I count 12 Final Fours and 4 Titles in the post-1979 era among this group. But, they all also share the resume lines of either a relatively large number of upset losses or a small number of upset wins… or both. Lute Olson does have a total of 11 upset wins to his credit, but he also has 13 upset losses and only 1 title in 28 tournament appearances. That all said, most of these coaches can use the excuse that they are not terribly lucky, as most of them have LOTD scores around 2.0 or lower. The odd exception to this is "Dollar" Bill Self, who has a LOTD score of 4.9 yet still underachieved pretty noticeably. The last few years have been particularly rough for Self, as he has not had a positive PASE, PARIS, or PAD score since making the Title Game in 2012 and he has not been below a 2-seed in any of those years.
10) If you think those guys are bad, meet the real under-achievers: Tony Bennett, Gene Keady, and Rick Barnes. If you want a couple more names, here they are: Mike Montgomery, John Thompson III, Jamie Dixon, Kelvin Sampson, and Fran Dunphy. All these guys PADs below -2.0 and share some common traits: winning percentages as favorites below 65% and hardly any upset wins. For this crew, they have almost all coached in over 10 tournaments and they virtually all only made the Sweet 16 at a clip of 30% of the time or less. Tony Bennett might be able to pull out of it, as his winning percentage as a favorite is over 70%, he has only been in 7 tournaments, and statistically he won’t draw Tom Izzo every year, but by any measure, these guys have struggled.
11) BONUS Observation: The seemingly truly elite coaches with more than 10 tournaments under their belt all have made Final Fours once out of every three years, on average. The numbers, specifically are: Coach K (36.4%), Izzo (35%), Roy Williams (33.3%), Rick Pitino (33.3%), John Calipari (33.3%), Dean Smith (31.6%). Now, go out and impress your friends with that bit of trivia.
Just for fun, here are two tables of all my stats for all active coach and then all coaches period with more than 10 tournament games. Enjoy!
Active Coaches (sorry if this is small)

All Coaches with 10+ Games:

Comments
Post a Comment