In Part One of this series on MSU football recruiting, I explored the question of how much "stars" really matter in college football recruiting. We found that while stars do certainly matter (five-star athletes are more likely to make an impact compared to four-star or three-stars athletes, as measured by NFL draft rates), Top 75 players are certainly not can't-miss prospects, and NFL talent can be found almost anywhere. The rate at which these high school stars get drafted into the NFL follows a predictable curve that gives us a probability that any given player will eventually hear his name called on NFL draft weekend.
Based on this data, I introduced a new metric that I call "NFL Draft Potential" which can be used to quantify the "value" of a given recruit or recruiting class. As we will see, this is a powerful tool that can tell us a lot about college football recruiting. After the detailed introduction last time, it is time to dig into the details. As our first taste of how to use the NFL Draft Potential metric, let's start with something familiar: the past fourteen MSU recruiting classes. Let's first look at a visual of the breakdown of each class by the raw number of players in each rating bin.
 |
| Figure 1: Summary of the past 14 MSU recruiting classes by Rivals Rating |
In this case, I have used different patterns to separate the five-stars (dots, with a rating of 6.1), four-stars (diagonal lines, 5.8 to 6.0), three-stars (solid bars, 5.5 to 5.7), and two-stars (horizontal lines 5.2 to 5.4). From Figure 1 it is pretty easy to distinguish the larger classes (like 2017) from the smaller ones (like 2013). One can also see that MSU signed only two five-star players in this time frame (Gholston in 2010 and McDowell in 2014). MSU had a lot of four-star recruits in 2009 and 2016, as well as a fair amount in 2014 and 2015. 2007, 2008, 2010, and 2017 seemed to have more two-star recruits than usual. But, by just looking at this data, it is hard to really tell which classes were relatively strong and which ones were relatively weak.
In order to answer this question, let's now plot this same data, but instead scale it using the NFL Draft Potential metric. That data is shown here:
 |
| Figure 2: Summary of the past 14 MSU recruiting classes based on NFL Draft Potential. Actual number of players to be drafted or make an NFL team are shown at the top of each bar |
Now, it is straightforward to see at a glance which classes were stronger or weaker overall. Not surprisingly, Coach Dantonio's first two class (2007 and 2008) were the weakest by this metric, with an NFL Draft Potential score of 1.85 and 1.70 respectively. The 2009 class is the one with the highest overall NFL Draft Potential (3.24) of any class in the Coach Dantonio era.
The next four classes (2010 to 2013) all saw a gradual decline in the Draft Potential metric, reaching a low point of 1.85 in 2013. The 2013 class was also small (only 17 commitments) which does impact this cumulative metric. But, as we all know, MSU won the Rose Bowl on New Year's Day of 2014, and the next three classes showed a clear "Rose Bowl Bump." The 2014, 2015, and 2016 classes were three of the top four classes that Coach Dantonio signed and all of them had NFL Draft Potential scores over 2.5.
Then, the 2016 season happened, and the final four classes of the Dantonio Era seem to have suffered as a result. The NFL Draft Potential score of the last four classes vary from just under 2.5 (in 2018) to just under 2.0 last year. But, it should be pointed out that the total NFL Draft Potential of the classed from 2010 to 2013 is virtually identical to the NFL Draft Potential of MSU's last four classes (8.50 vs. 8.76). Actually, in principle, there should be slightly more talent as the roster now than there was in the fall of 2013. While MSU's recruiting over the past four years has been down relative to the high point in 2014-2016, it is essentially exactly at the level where it was when the Rose Bowl and College Football Playoffs teams were built.
Now, there is only other set of data shown in Figure 2 that I will mention here briefly. Above each bar I have listed the total number of players in each class who eventually were either drafted OR made an NFL roster (which is different that the metric I use to create the NFL Draft Potential metric). There is a total of 33 players from the 2007 to 2011 who eventually at least had a cup of coffee in the NFL. Those players include Greg Jones (5.7 in 2007), Kirk Cousins (5.5 in 2007), Keshawn Martin (5.6 in 2008), Jerel Worthy (5.6 in 2008), Edwin Baker (6.0 in 2009), Bennie Fowler (5.6 in 2009), Max Bullough (5.8 in 2010), Jeremy Langford (5.6 in 2010), Conner Cook (5.7 in 2011), and Shilique Calhoun (5.5 in 2011).
However, from the 2012 class to the almost completed 2016 class, a total of only eight players have made the NFL. While the jury is still out on several undrafted free agents that just graduated, that is still a significant decrease, no matter how you calculate it. While I will discuss this issue in more detail later in this series, for now I just want to draw the difference between Draft Potential (input) and actual performance (output). On signing day, all we really have to go on is data from High School. My NFL Draft Potential metric give a probability of success. On average, over an entire recruiting class in the entire Power Five, these probabilities are robust. But, for individual teams and classes, a lot of variation can and does take place. Time will only tell what Coach Tucker and the new staff will be able to do with the talent that they inherited.
National Class Rankings
It is interesting to compare the relative strength and weaknesses of different MSU classes using a consistent metric. But, MSU teams do not compete with other MSU teams, they compete with teams like Michigan, Ohio State, Wisconsin, Indiana, and Rutgers. On the lead up to Signing Day, fans always want to know where their team's class is ranked. But, how much better is the No. 1 team compared to the No. 25 team or the No. 40 team? Fortunately, the NFL Draft Potential metric provides a way to clearly answer these questions as well. Figure 3 below compares all 66 Power Five schools using this metric for the 2020 recruiting cycle.
 |
| Figure 3: 2020 Class Rankings Based on NFL Draft Potential |
Based on this metric, MSU's 2020 class ranked 39th among Power Five teams. In general, this tracks well with the formulas used by the main services. Rivals ranked MSU's class No. 36 and 247 ranked the class as No. 43. But, the most interesting features of this data set is the shape of the curve and the magnitude (the y axis). As is clear, the curve bends up sharply at the very top. The top three teams in the country all have an NFL Draft Potential scores over 6.0, the next three team have scores over 5.0, and the rest of the Top 10 have scores over 4.0. These are clearly the cream of the crop, and interestingly, there are three different tiers all within the Top 10. The top three classes are projected to have 50 percent more potential NFL draft picks compared to the No. 10 class. That seems significant.
After the Top 10, the distribution levels off noticeably. From No. 11 to No. 23, the NFL draft potential score falls between 3.0 and 4.0. Then, at No. 24, there is a sharp drop to another plateau that extends roughly from No. 25 to No. 40. The remainder of Power Five teams come after that with NFL Draft Potential Scores roughly between 1.0 and 2.0.
Figure 3 is also labeled with the Top 10 teams, as well as all 14 Big Ten teams and a few other notable schools. Based on the figure, it is straightforward to categorize each Big Ten class into tiers that roughly correspond to integer values of the NFL Draft Potential metric. First in 2020 is Ohio State (ranked fourth overall), in the tier that I will label "Tier 1B." Next is "Tier 2" which includes Penn State (11), Michigan (12), Nebraska (16), and Notre Dame (22) all with scores generally between 3.0 and 4.0 and who reside in the Top 25. Tier 3 includes teams with NFL Draft Potential scores roughly between 2.0 and 3.0 such as Maryland (24), Wisconsin (30), Purdue (34), Minnesota (37), and MSU (39). The remaining four Big Ten teams: Indiana (55), Northwestern (56), Rutgers (62), and Illinois (65) all fall into Tier 4 with scores roughly between 1.0 and 2.0.
In general, the shape of this figure seems to be fairly consistent from year to year. Below, I show the same figures compiled for the 2017 to 2019 recruiting classes. While the curves are different, the general shape is the same, including a consistent set of tiers. The number of teams in each tier is a bit variable, however. In 2018, for example, Tier 2 (NFL Draft Potential Scores between 3.0 and 4.0) appears to be a bit small and/or weak with a drop-off around a ranking of No. 15. But, the general shape is consistent back to at least the 2007 recruiting cycle. As a general rule, MSU has been a "Tier 3 / Top 40" team for most of the Coach Dantonio era, with a few classes (2009 and 2016) in Tier 2 and the early classes in Tier 4.
 |
| Figure 4: 2019 Class Rankings Based on NFL Draft Potential |
 |
| Figure 5: 2018 Class Rankings Based on NFL Draft Potential |
 |
| Figure 6: 2017 Class Rankings Based on NFL Draft Potential |
In Part One of this series, I threw a bit of shade on the methods of the major recruiting services in assigning "points" to recruiting classes. For comparison purposes, I now want to show the same basic data using the point systems developed by Rivals and 247 for the 2020 classes. That data is shown here.
 |
| Figure 7: 2017 Class Rankings Based on Rivals Points |
 |
| Figure 8: 2017 Class Rankings Based on 247 Points |
As a general rule, the point systems from Rivals and 247 qualitatively capture the same information captured by the NFL Draft Potential metric and the general team rankings land in similar positions. The general shape of the Rivals curve is very similar to my NFL Draft Potential and I don't think that stems exclusively from the fact that we use the same set of data. I think that it speaks more to the similarity in the formulas used to compare classes. The curve from 247 is noticeably more linear with no clear tiers in the data.
As for the magnitude of the points, there is a clear difference in the three systems. As it turns out, the NFL Draft Potential metric actually provides more separation between the truly elite teams and the good to very good ones. Based on this system, a team with a Top 3 recruiting class and an NFL Draft Potential score of 6.0 has twice as much potential NFL talent than the average class ranked No. 25. Based on Rivals points, we would conclude that a Top 3 team's class is roughly twice as good as only the No. 40 team. In the 247 system, the points fall off even more slowly. For a variety of reason that I laid out in Part One, I stand by my metric as a superior measure of recruiting "quality."
Comparisons to Other Big Ten Teams
Finally, I wanted to take a closer look at how MSU's historical recruiting performance compares to notable rivals and other Big Ten teams. When it comes to water cooled discussion in the state of Michigan, only one other team matter: The Michigan Wolverines. So, let's compare the NFL Draft Potential scores of MSU and UofM back to 2007, with the approximate recruiting Tier denoted on the Figure
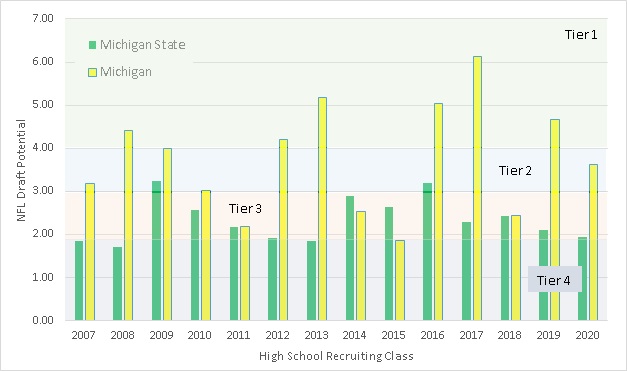 |
| Figure 9: Comparison of the past 14 MSU and UofM recruiting classes, based on NFL Draft Potential |
As any UofM fan will gladly explain, based on this metric, UofM "out-recruits" MSU pretty consistently. As stated above, MSU is typically a Tier 3 (Top 40ish) recruiting power that occasionally cycles up to Tier 2 (Top 25ish) or cycles down to flirt with Tier 4. As for UofM, they seem to be more erratic. Over the past 14 classes, UofM has posted six Tier 1 (Top 10ish) recruiting classes, four Tier 2 classes (Top 25ish) and four Tier 3 classes (Top 40ish).
If one were to bring up this statistic with a typical UofM fan, the most likely reply would be that Rich Rod most likely accounted for Tier 3 classes, Hoke had mostly Tier 2 classes, and Saint Harbaugh's classes have all been Tier 1. But, the facts tell a different story. While three of Michigan's Tier 1 classes, including the best class of the group (2017) were recruited under Harbaugh's watch, four of the top seven classes were signed by Rich Rod and Hoke (2008, 2009, 2012, and 2013). Furthermore, Harbaugh's past three full classes include one Tier 1, one Tier 2, and one Tier 3 class with an average NFL Draft Potential score of 3.58. Classes in the Hoke era (2012 to 2015) averaged 3.45, while RichRod's full classes (2009 to 2011) averaged 3.07. Coach Harbaugh's recruiting seems to be slightly better than Hoke, but the difference is not very significant.
Either way, Figure 9 shows that the "talent gap" between MSU's and UofM's classes has fluctuated over time. Michigan has enjoyed over a one-player advantage in NFL draft potential in 2007, 2008, 2012, 2013, 2016, 2017, 2019, and 2020. However, the gap was smaller or non-existent is 2009, 2010, 2011, 2014, 2015, and 2018. At this point, I don't think that this data set alone can tell us if there is a clear correlation between these recruiting gaps and actual wins and losses on the field. Suffice it to say that UofM has consistently "out-recruited" MSU by an average of 1.41 NFL Draft Potential players per class, yet MSU has enjoyed an 8-to-4 advantage on the score board over the past 12 seasons.
As a final set of data for today, I wanted to share a comparison of the past five recruiting classes for each Big Ten team, broken into four groups. Let's start with the three teams that have recruited the best over the past five classes:
 |
| Figure 10: Comparison of the previous five recruiting classes for the top group of Big Ten teams. Average NFL Draft Potential score is shown in the legend |
If one were to guess which three teams have the highest average NFL Draft Potential scores over the past five classes, a guess of Ohio State, Michigan, and Penn State would be a good one (and also correct). Predictably, the Buckeyes are at the head of the class with an average NFL Draft Potential score of 5.32 players per class and have finished in first place in the conference in four of the past five years. Michigan and Penn State are second and third at 3.96 players and 3.76 player respectively. Both teams solidly recruit at a "Tier 2" level, but even so, both teams have posted a "Tier 3" class once in the past five years.
Next up is a group of four teams that average NFL Draft Potential scores solidly in the Tier 3 / Top 40 category.
 |
| Figure 11: Comparison of the previous five recruiting classes for the second group of Big Ten teams |
Next, interestingly, is Maryland, a team that has generally struggled and not turned their solid recruiting performance into on-field wins. Last in this group (and seventh overall in the Big Ten) is Wisconsin. A case could certainly be made that the Badgers have been the second best team in the conference over the past 10 or more years, despite a long history of "mediocre" recruiting. While their position in the Big Ten West may influence this, I think that there is more to it. After all, Nebraska should have the same advantages and have actually out-recruited Wisconsin for five straight years. Clearly, there is more to football success than recruiting.
Finally, here are the charts for the bottom half of the Big Ten, who in general have all averaged recruiting in the bottom, Tier 4 category:
 |
| Figure 12: Comparison of the previous five recruiting classes for the third group of Big Ten teams |
 | |
|
The final group of teams is made up of essentially the current Big Ten bottom feeders: Indiana, Illinois, Rutgers, and Northwestern. Figure 12 suggests that these team have recruiting classes that hover around an NFL Draft Potential score of 1.50, with some minor cycles up or down. Rutgers had a relatively good class in 2017. Illinois did OK in 2017 and 2018, while Indiana made it over 2.0 in 2018 and 2019. Ironically, the team that recruits the worst in this group. Northwestern, is the only team that has made it to Indianapolis for the Big Ten Championship game.
As the story of Northwestern and Wisconsin (and Michigan) highlight, recruiting rankings are not everything. Simply accumulating high school plays with stars next to their name does not guarantee success on the field (but it certainly helps). In the next article in this series, I will turn my focus from "input" (recruiting potential) to "output" (on field performance). Stay tuned.
Comments
Post a Comment