It is officially the most wonderful (sports) time of the year! As we all think about our Final Four and upset picks for our office pools, I thought that I would provide some unsolicited, stat-based advice on how to fill out your bracket. Full disclosure right off the bat: I am actually not that good at winning my office pool. I think that last time I actually finished first was 2002. But, I certainly have a lot of data that sheds some insight as to how likely certain events are. I personally think that data, combined with the good old fashioned eye-test, is the best combination. I will do my best to provide the first part.
General Methodology
Over the past few decades I have slowly accumulated data and developed more and more advanced tools to understand the role of variance and probability as it applies to college basketball. I could go on about this for days, so I will try to highlight the key points here that underpin my entire philosophy:
1) Overall, the best predictor of the probability that a team will win or lose is the Vegas spread.
I have developed a formula based on the normal distribution that fits the data spanning decades and thousands of games. I use that for pretty much all of my calculations
2) The results of games have a lot of variance
The standard deviation of an actual result from the spread is just over 10 points. Actually, I even can tell you why it is 10 points, but that is another story for another day.
3) NCAA tournament games behave exactly as regular season games do, statistically speaking. In other words, the two "rules" above also apply.
4) Advanced metrics, such as Kenpom efficiencies, are a good predictor of spreads, and therefore they can be used to project win probabilities.
With all this said, one of my favorite charts that I have developed is the following, which compares the observed rate of the higher seed winning in a given seed pairing to the probability predicted based on the average spread of that same pairing.


The historical seed comparison chart and simulation results table for the Midwest Region are shown below.


As the chart shows, the 2-, 5-, 6-, and 7-seeds are quite strong, while the 1-, 3-, and 4-seeds look pretty average. In the first round, this does not look like it is going to manifest itself (although Kansas is on a very mild upset alert), but the 2nd round is where things might get interesting.
The simulation suggests that Auburn has a much better than average shot at getting to the Sweet 16, while Iowa St and Wofford would be tougher than expected challenges for Houston and Kentucky. Utah Sate also projects to be a slightly scarier than usual 2nd round challenge for UNC.
If UNC and Kentucky both survive to the Regional Final, Kentucky would have a great shot at a mild upset. However, this bracket looks like it has the potential for the one to produce the wildcard. I might be tempted to take Auburn to win the Region.
West Region Breakdown
Finally, here is the seed comparison chart and simulation results table for the West Region

Based on the chart, the Top 3 seeds in the West are all quite strong, while the rest of the top 10 seeds are pretty average with the exception of Marquette, who is a "weak" 5-seed and Florida, who is a "strong" 10-seed. For this reason, both Marquette, and especially Nevada are on upset alert in Round 1. Incidentally, Vegas agrees on Marquette, but is not as optimistic about Florida.
The second round does not give an strong indications of an upset, but Texas Tech is projected to be a tougher match-up than usual for 2-seed Michigan in the Sweet 16. The winner of this potential Texas Tech - Michigan match-up would put Gonzaga on a mild upset alert, I think the odds would favor the Zags pulling this one out.
On a side note, the Vegas odds suggest that if a 2-seed were to get upset this year, the mostly likely (yet still very unlikely) victim would be the Wolverines at the hands of the Montana Grizzlies.
Add it Up
So, in summary, if I use Kenpom data, math, and use history as a guide, I get the following results:
1st Round upsets:
14-Yale over 3-LSU
13-UC Irvine over 4-K State
12-Murray State over Marquette
11-St. Mary's over 6-Villanova
10-Iowa over Cincinnati
10-Florida over Nevada
9-Oklahoma over 8-Ole Miss
2nd Round Upsets:
7-Wofford over 2-Kentucky
6-Iowa State over 3-Houston
5-Auburn over 4-Kansas
3rd Round Upsets:
5-Auburn over 1-UNC
4-VA Tech over 1-Duke
3-Purdue over 2-Tennessee
Final Four
1-Virginia
1-Gonzaga
2-MSU
5-Auburn
And, if I really go all the way with Kenpom, I would have to take Virginia over Gonzaga in the Title Game.
So, that is that. I will probably use this bracket in one of (but not my "real") online brackets. But, ultimately, the eye test matters. It will be fun to see how this pans out.
Enjoy!
General Methodology
Over the past few decades I have slowly accumulated data and developed more and more advanced tools to understand the role of variance and probability as it applies to college basketball. I could go on about this for days, so I will try to highlight the key points here that underpin my entire philosophy:
1) Overall, the best predictor of the probability that a team will win or lose is the Vegas spread.
I have developed a formula based on the normal distribution that fits the data spanning decades and thousands of games. I use that for pretty much all of my calculations
2) The results of games have a lot of variance
The standard deviation of an actual result from the spread is just over 10 points. Actually, I even can tell you why it is 10 points, but that is another story for another day.
3) NCAA tournament games behave exactly as regular season games do, statistically speaking. In other words, the two "rules" above also apply.
4) Advanced metrics, such as Kenpom efficiencies, are a good predictor of spreads, and therefore they can be used to project win probabilities.
With all this said, one of my favorite charts that I have developed is the following, which compares the observed rate of the higher seed winning in a given seed pairing to the probability predicted based on the average spread of that same pairing.
As you can see, the correlation is very good, with a few exceptions. For example, 1-seed do better than expected vs. 5-seeds and 9-seed, and 2-seed fair surprisingly poorly vs. 10-seed. But, I think that this is simple normal statistical variance due to a smallish sample size, and nothing more. If nothing else, this chart is a handy reference on how often upset occur for a wide variety of seed pairings.
A "Normal" Tournament Bracket
So, as you prepare to fill out your bracket, one obvious question is how many upsets can you expect in a "normal" year and what does a "typical" Final Four look like?
As for the first question, here are a few rules of thumb
1) In the first round, one typically sees 8 ± 2.5 upsets, with over half of those happening to 6-, 7-, or 8-seeds.
On average, the 8-9 games are a coin flip, you would expect 3 upsets between the 6- and 7-seeds, 2 more upsets between the 4- and 5-seeds, and maybe 1 "major" upset of a 1-, 2-, or 3-seed.
2) In the 2nd round, one would expect to see 4.5 ± 2 upsets.
The rate of which a 1-seed loses in the second round is almost exactly once every 2 years. For the 2-, 3-, and 4-seeds, one would expect to see 4 total upsets in that group in a year, and they are oddly pretty evenly distributed between those 3 seeds.
Also note that if there are an above average number of upsets in the first round, there tends to be fewer second round upsets and vice versa. This is practically just a simple result of the fact that the weaker teams tend to get picked off in the second round if they survive the first round. Because I am a nerd, I like to call this the "Law of the Conservation of Upsets." You're welcome.
3) As for the Sweet 16 games, things get a bit messy
A general rule of thumb is that a little over half (55%) of 1-seeds make the Regional Final, while a little less than half (42%) of 2-seeds make it, and usually only one 3-seed per year gets that far.
4) As for the Final Four, while it is tempting to take something like three 1-seeds, that rarely happens (only 13% of the time)
History shows that one 1-seed almost always makes it. Two 1-seeds only happens half the time. The average seed of the 3rd best Final Four team is 3, while the lowest average seed is an astounding 5.7 and is no better than a 4-seed in over half of all tournaments.
So an "average" Final Four is a 1-seed, a 1- or 2-seed, a 3-seed, and something lower than a 4-seed. That exact scenario had happened in both of the two previous years.
With that (already too long intro) let's now dive into the 2019 bracket, starting with the South
East Region Breakdown
This year, I came up with two new "tools" to help visualize the strengths and weaknesses of each bracket. The first set of data compares the current Kenpon rating (shorthand for the adjusted efficiency margin) for each seed to the average and standard deviation of the rating historically (back to 2002, the beginning of Kenpom's data set) For the East, these data are shown here:
This plot alone gives us quite a bit of information about how this region might play out. For example, LSU is a pretty below average 3-seed and in the first round, they play an above average 14-seed in Yale. Uh oh...
In order to take this analysis a bit further, I conducted a series of simulations of the East Region, using Kenpom data to project point spreads and therefore win probabilities. I tabulated the probability that each team would survive each round up to advancing to the Final Four. I then also compared this probability to the probability that I got when I simulated a "generic" bracket made up of teams with a statistically average Kenpom rating for their seed. So, this gives us an idea if a team has an above or below average chance to advance. My thought is that this should provide hints as to where those exciting upsets might happen. Here is the table for the East:
At this point, I want to say that I also tried this analysis using the actual spreads for the first round games that are currently available. Based on my own methodology, this should be more accurate. In general the trend were the same, with a few exceptions that I will note along the way. But, the spreads this year seem oddly conservative and since there will be no spreads for any games after the first round until it is too late, I decided to stick to a purely Kenpom-based analysis.
Back to the table. There is a lot going on here.
The first thing to note about the East is that with the exception of one team (LSU) the Top 8 seeds are all "above average" and therefore first round upsets are less likely in this Region. The opening Vegas lines agree with this assessment. But, as we will see, LSU is the only Top 3 seed projected to have less than an 80% chance to win in the first round. So, if you were forced to pick one "big" 1st round upset (and history suggests we will see one), Yale over LSU is the most likely.
As we move onto the 2nd round, again only LSU (if they make it) would be expected to be a possible upset victim. In the Sweet 16, MSU's odds look good (mostly due to LSU), while Dukes's odds are surprisingly depressed, due to the fact that both Virginia Tech and (to a lessor extent) Mississippi State are above average 4- and 5-seeds. Might Duke be one of the 1-seeds to fail to make the Regional Final? (One can hope!)
Finally, in the chance that Duke and MSU meet in the Regional Final, Kenpom projects that Duke would only be a 0.5-point favorite over MSU. (You can choose to believe that or not, but that is what the math says). As a result, Duke's odds to make a Final Four are a bit low for a 1-seed, while MSU's odds are quite high, and just a shade behind Duke.
I hate to say this, but based on all the probability and historical data I have shown so far, MSU is a reasonable bet to win this Region, and that is not (just) a homer pick.
South Region Breakdown
Following the same path as above, here is the historical seed comparison chart followed by the simulation results table for the South Region
Already, the South seems like it might be more interesting than the East, and perhaps also very kind to the Big Ten. Purdue, Wisconsin, and Iowa all show better than average odds to advance, while K-State, Cincinnati, and especially Villanova all might be on upset alert. Kenpom also likes the 9-seed (Oklahoma) here.
If K-State were to survive the first round, Kenpon suggests the Badgers might get them in the next round anyway. Purdue's odds to make the Regional Final are surprisingly high, which suggests a possible upset of Tennessee here. But, at the end of the data, the math really likes Virginia to roll through this region.
That all said, I should mention that while the Vegas spread does put K-State on upset alert, those numbers are much less favorable to Wisconsin and Iowa. Actually, based on the Vegas line, Wisconsin is the most likely 5-seed to get upset by the dreaded 12-seed (Oregon), and Villanova's chances look much better based on the Vegas line. This will be an interesting test of which method (Kenpom vs. Vegas) is a better predictor.
Midwest Region Breakdown
The historical seed comparison chart and simulation results table for the Midwest Region are shown below.
As the chart shows, the 2-, 5-, 6-, and 7-seeds are quite strong, while the 1-, 3-, and 4-seeds look pretty average. In the first round, this does not look like it is going to manifest itself (although Kansas is on a very mild upset alert), but the 2nd round is where things might get interesting.
The simulation suggests that Auburn has a much better than average shot at getting to the Sweet 16, while Iowa St and Wofford would be tougher than expected challenges for Houston and Kentucky. Utah Sate also projects to be a slightly scarier than usual 2nd round challenge for UNC.
If UNC and Kentucky both survive to the Regional Final, Kentucky would have a great shot at a mild upset. However, this bracket looks like it has the potential for the one to produce the wildcard. I might be tempted to take Auburn to win the Region.
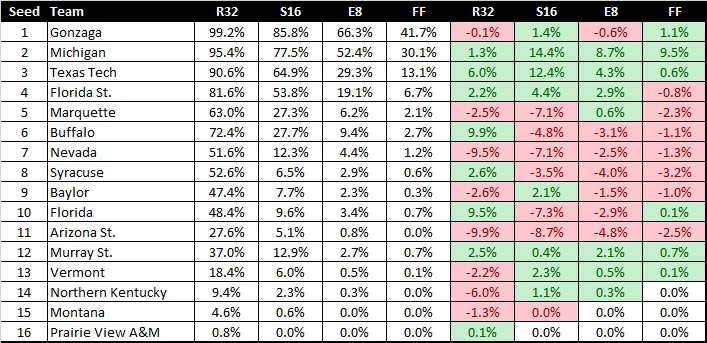
West Region Breakdown
Finally, here is the seed comparison chart and simulation results table for the West Region
Based on the chart, the Top 3 seeds in the West are all quite strong, while the rest of the top 10 seeds are pretty average with the exception of Marquette, who is a "weak" 5-seed and Florida, who is a "strong" 10-seed. For this reason, both Marquette, and especially Nevada are on upset alert in Round 1. Incidentally, Vegas agrees on Marquette, but is not as optimistic about Florida.
The second round does not give an strong indications of an upset, but Texas Tech is projected to be a tougher match-up than usual for 2-seed Michigan in the Sweet 16. The winner of this potential Texas Tech - Michigan match-up would put Gonzaga on a mild upset alert, I think the odds would favor the Zags pulling this one out.
On a side note, the Vegas odds suggest that if a 2-seed were to get upset this year, the mostly likely (yet still very unlikely) victim would be the Wolverines at the hands of the Montana Grizzlies.
Add it Up
So, in summary, if I use Kenpom data, math, and use history as a guide, I get the following results:
1st Round upsets:
14-Yale over 3-LSU
13-UC Irvine over 4-K State
12-Murray State over Marquette
11-St. Mary's over 6-Villanova
10-Iowa over Cincinnati
10-Florida over Nevada
9-Oklahoma over 8-Ole Miss
2nd Round Upsets:
7-Wofford over 2-Kentucky
6-Iowa State over 3-Houston
5-Auburn over 4-Kansas
3rd Round Upsets:
5-Auburn over 1-UNC
4-VA Tech over 1-Duke
3-Purdue over 2-Tennessee
Final Four
1-Virginia
1-Gonzaga
2-MSU
5-Auburn
And, if I really go all the way with Kenpom, I would have to take Virginia over Gonzaga in the Title Game.
So, that is that. I will probably use this bracket in one of (but not my "real") online brackets. But, ultimately, the eye test matters. It will be fun to see how this pans out.
Enjoy!
Comments
Post a Comment