With the One Shining Moment and the rest of the 2018-19 basketball season now in the rear-view mirror, it is that time of year to reflect on the past season and (if you are me) crunch a few more numbers based on yet another year of accumulated stats. The first topic on my math to-do list is something that piqued my interested in the middle of this year's tournament. After the first weekend, it was reported that a single person on-line had successfully picked every single tournament game (48 in total) correctly. While this is clearly a tough thing to accomplish, the obvious question is "how tough?" What are the odds of this kind of bracket perfection, and what is the "correct" way to calculate it?
As you might expect, I am not the first person to think about this problem. Warren Buffet perhaps stimulated most of this discussion when in 2014 he started to offer multi-million or even $1 billion dollar rewards for different variations on a perfect bracket, either just up to the Sweet 16 or a full perfect bracket. Largely in response to this publicity, math and stats gurus started to take aim at answering the question as to how likely it was that Buffet would need to pay up.
There is one extremely simple way to think about this problem. If you assume a person is simply randomly guessing on the winner of each game, the odds are very easy to calculate. It is the same as the odds of correctly guessing the result of 63 consecutive coin flips, which is 1 in 2 multiplied by itself 63 times (2^63). In other words:
1 in 9,223,372,036,854,780,000
Those are pretty long odds. (Also note that although there are 68 teams in tournament, most mainstream bracket contests ignore the results of the First Four. With the remaining 64 teams, they play in 63 total games, with one team being eliminated in each game until 1 team remains).
Although a lot of people will reference the number above, it isn't correct. That is because games are clearly not just coin flips with each team having equal probability of victory. The obvious example of this is the set of first round games between 1-seeds and 16-seeds. If one were to enter a contest where one only needs to pick the winner of these 4 games, the obvious strategy is to take all the 1-seeds. In 40 of the past 41 tournament, this would be the winning strategy. However, in 2018, that would not have been the case, as UMBC upset 1-seed Virginia in historical fashion.
This particular example gives valuable insight into how to think about the problem of the odds of a perfect bracket. What would the odds be to "win" the 1-seed vs. 16-seed Challenge? In most years, the odds would be close to 100%, as long as one knew that 1-seeds (almost) always win in the 1st round. But, what about in 2018? Let's say that there was one brave UMBC grad that decided to take a flier on his alma mater. What would his odds have been? My math suggests that this type of upset should occur about 1% of the time (about once every 25 years). So, I think that it is reasonable to say that this UMBC grad had about a 1% chance to win this contest with that bracket.
This example tells us several things:
1) The odds to pick a "perfect bracket" seem to be equivalent to the odds of that bracket occurring
2) Therefore the odds of a perfect bracket are not the same from year to year and can vary widely
3) If you can estimate the probability of victory for each potential match-up, that should allow you to make the appropriate calculation
In my various internet searches related to this topic, most people who have thought about this problem have come to the same basic conclusions. Professors at various Universities have weighed in on the topic. One Professor at Depaul gave the odds at 1 in 128 billion (or perhaps "as low as" that). Another professor at Duke suggested it was 1 in 2.4 trillion.
But, perhaps the best analysis I have seen is from Nate Silver at 538.com, who calculated the odds of a "perfect bracket" in 2014 to be 1 in 7.4 billion, yet only 1 in 1.6 billion in 2015. But, these odds seem rather low in comparison to the odds above. As I looked at 538's data in more detail, it became clear that his definition of the "perfect bracket" is different than mine. He is calculating the odds that the tournament goes as close to chalk as possible, as opposed to how the tournament actually played out. So, the numbers that he quotes are not the odds that you will win the Warren Buffet office pool. Instead, they are the odds of the favored team (based on his math and not on seeds) wins every game. This is, technically, the most likely overall single result, and as such it is the lower bound on the odds to win the Warren Buffet office pool for that year.
But, perhaps the best analysis I have seen is from Nate Silver at 538.com, who calculated the odds of a "perfect bracket" in 2014 to be 1 in 7.4 billion, yet only 1 in 1.6 billion in 2015. But, these odds seem rather low in comparison to the odds above. As I looked at 538's data in more detail, it became clear that his definition of the "perfect bracket" is different than mine. He is calculating the odds that the tournament goes as close to chalk as possible, as opposed to how the tournament actually played out. So, the numbers that he quotes are not the odds that you will win the Warren Buffet office pool. Instead, they are the odds of the favored team (based on his math and not on seeds) wins every game. This is, technically, the most likely overall single result, and as such it is the lower bound on the odds to win the Warren Buffet office pool for that year.
Although my initial purpose is different, the method used by 538 appears sound. In order to calculate the odds of most likely ("chalk") bracket or the actual final bracket, one only needs a way to calculate the win probabilities for any arbitrary tournament match-up. Fortunately, I know a good way to do that. I used the pre-tournament efficiency data from Kenpom to generate point spreads, and then used my own formula to calculate the probability that either team would win any potential match-up. When I ran these numbers for the 2019 tournament, I got the following numbers
Correct bracket up to the Sweet 16 (48 games): 1 in 540 million
Odds of the most likely / chalk bracket: 1 in 6.4 billion
Odds of the most likely / chalk bracket: 1 in 6.4 billion
Odds if the correct full bracket (all 63 games): 1 in 3.2 trillion
As for the man who picked the Sweet 16 correctly this year (who happens to be a Michigan fan from Saginaw...) his bracket was finally busted after Game 49. This was apparently the longest streak of correct picks on record. One analysis suggests the odds for this accomplishment were a bit better than I calculated. (They said only 1 in 140 million based in this article.) But, their method used the probability extracted from the money line of each game, which I don't think is quite as accurate. (The odds derived from the money line for both teams in a single contest don't sum to one. That is partially how Vegas makes money...) So, in general, I think my method and numbers are solid.
While we now know the odds of this specific tournament, I was wondering if I could get a feel for how much variation in these odds might exist. An "easy" to approach this was to use the historical Kenpom data (which goes back to 2002) and run the same calculations for both the "most likely / chalky" bracket as well as the actual final tournament bracket. Regarding the mostly likely bracket, the results of those calculations are shown here as a function of year.

Also, for reference, here are the odds the first two rounds goes to all of the favorites (48 games total)
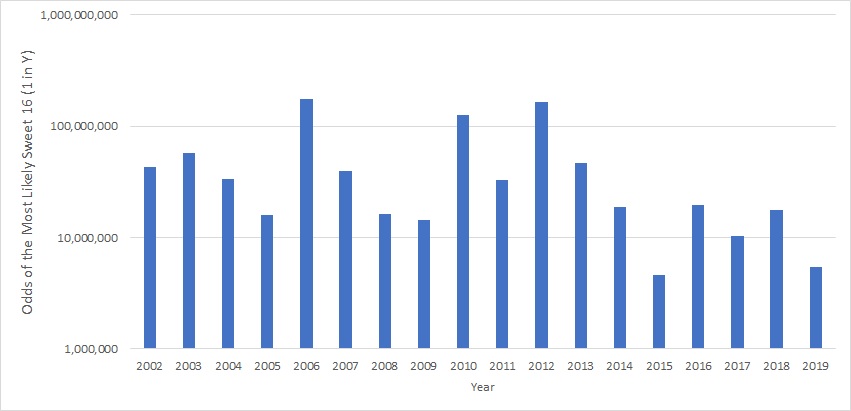
As you can see, there is quite a bit a variation in the odds from year to year, but in two-thirds of the years, the odds are in the 1 in 10s of billions range. There are only two years with better odds: 2019 (with odds of 1 in 6.4 billion) and 2015 (with odds of 1 in 4.4 billion). In the four remaining years (2003, 2006, 2010, and 2012) the odds are in the 1 in 100s of billions range. For the Sweet 16, at best one would have a 1 in 4.5 million shot to get that exactly right, but the odds could be as long as 1 in over 170 million.
But, what is the source of this variation from year to year? One idea that I had was based on an observation that I made about this year's tournament. Based on the Kenpom efficiency margin data, the 2019 tournament seemed a bit top-heavy. The Top 10 teams or so overall seemed to be all above average in comparison to the historical efficiencies of past 1-, 2-, and 3-seeds. UVA, Gonzaga, Duke, and MSU were all in the Top 21 all-time in Kenpom efficiency margin going into the tournament. So, I plotted the average efficiency margin data as a function the odds of the most likely bracket coming to pass. As I adjusted the parameters, I found that the best fit to the data occurred when I correlated these odds to the average efficiency margin of the 1-, 2-, and 3-seeds. That data is shown below. With the exception of two mild outliers (2002 and 2005), the fit is really good.

This bring me to one first conclusion:
1) NCAA Tournaments that are more top heavy, especially in the Top 10 teams or so, are more predictable.
In terms of raw probability the "most predictable" bracket in the last 20 years was in 2015, which was just a little over 100 times more predictable than the least predictable tournament in 2006. While the difference between odds of 1 in 4 billion and 1 in 500 billion is practically meaningless, this does give us an interesting way to measure the parity in a given bracket in any given year.
At a side note, I should mention that the odds that I am calculating are a bit longer than the odds that Nate Silver / 538 got in his analysis of the 2014 and 2015 seasons as referenced above. Of course, I am using a different model and set of data (Kenpom) as my input, so there is no surprise that the numbers don't match. However, based on the analysis above, it seems likely that the 538 model generally must predict less parity than the Kenpom system, especially at the top. If nothing else, while these numbers are interesting to know (at least for me), this is not an exact science, and we are dealing with relative probabilities that we only in reality know within a factor of 10 or so.
While knowing how rare it would be for a tournament to happen when the favored teams wins in 63 straight games, I find that the more interesting question is that of the odds of a truly perfect bracket which would win the full tournament version of the Warren Buffet challenge. When I ran those numbers for the last 18 years, here is the result:

For reference, here are the actual odds for getting making the correct picks up to the Sweet 16 each year.

While the best possible odds to pick the winning bracket are in the "1 in a billion" range, the odds to correctly predict a real tournament are much, much worse. In fact, 2019 was the "most predictable" tournament with odds at 1 in over 3 trillion, which is about 500 times less likely than the most likely / chalk bracket. As for just getting up to the Sweet 16 fully correct, this year's odds of 1 in 540 million are by far the best of record (which explains why one person actually succeeded). In all previous years back to 2002, the odds were at least 1 in a billion, and have been as high as 1 in 1.8 trillion just last year.
Furthermore, the spread in this data set is clearly larger than in the previous set. In the "most likely / chalk" set, the difference between the most likely bracket and the least likely bracket was a factor of 100. When it comes to the real brackets, this difference is a factor of roughly 50,000. As a general rule, your odds of correctly predicting the result of all 63 NCAA Tournament games is about 1 in 100 trillion, with a very large variance. The odds can be as high as 1 in over 100 quadrillion for a year like 2011.
What is the source of this variance? It turns out to be simple statistical variation. Basically: luck. In some tournaments, a lot of big upsets are observed, and in others, there are very few. As anyone who has every participated in an NCAA office pool knows, upsets are unpredictable, and some upsets are way less predictable than other.
In order to explore this final avenue, I used the same Kenpom efficiency and probability data to set up a simple "Monte Carlo"-style simulation of the 2019 tournament. In general, I wanted to use this method to try to help me fill out my office pool bracket (which was very, very helpful). Considering that I need the exact same probabilities to run the simulation as I do to calculate the odds of a specific bracket occurring in the first place, I could essentially kill both birds with one stone.


In general, the correlation above is not superb, but I think it does prove my main point.
While we now know the odds of this specific tournament, I was wondering if I could get a feel for how much variation in these odds might exist. An "easy" to approach this was to use the historical Kenpom data (which goes back to 2002) and run the same calculations for both the "most likely / chalky" bracket as well as the actual final tournament bracket. Regarding the mostly likely bracket, the results of those calculations are shown here as a function of year.
Also, for reference, here are the odds the first two rounds goes to all of the favorites (48 games total)
As you can see, there is quite a bit a variation in the odds from year to year, but in two-thirds of the years, the odds are in the 1 in 10s of billions range. There are only two years with better odds: 2019 (with odds of 1 in 6.4 billion) and 2015 (with odds of 1 in 4.4 billion). In the four remaining years (2003, 2006, 2010, and 2012) the odds are in the 1 in 100s of billions range. For the Sweet 16, at best one would have a 1 in 4.5 million shot to get that exactly right, but the odds could be as long as 1 in over 170 million.
But, what is the source of this variation from year to year? One idea that I had was based on an observation that I made about this year's tournament. Based on the Kenpom efficiency margin data, the 2019 tournament seemed a bit top-heavy. The Top 10 teams or so overall seemed to be all above average in comparison to the historical efficiencies of past 1-, 2-, and 3-seeds. UVA, Gonzaga, Duke, and MSU were all in the Top 21 all-time in Kenpom efficiency margin going into the tournament. So, I plotted the average efficiency margin data as a function the odds of the most likely bracket coming to pass. As I adjusted the parameters, I found that the best fit to the data occurred when I correlated these odds to the average efficiency margin of the 1-, 2-, and 3-seeds. That data is shown below. With the exception of two mild outliers (2002 and 2005), the fit is really good.
This bring me to one first conclusion:
1) NCAA Tournaments that are more top heavy, especially in the Top 10 teams or so, are more predictable.
In terms of raw probability the "most predictable" bracket in the last 20 years was in 2015, which was just a little over 100 times more predictable than the least predictable tournament in 2006. While the difference between odds of 1 in 4 billion and 1 in 500 billion is practically meaningless, this does give us an interesting way to measure the parity in a given bracket in any given year.
At a side note, I should mention that the odds that I am calculating are a bit longer than the odds that Nate Silver / 538 got in his analysis of the 2014 and 2015 seasons as referenced above. Of course, I am using a different model and set of data (Kenpom) as my input, so there is no surprise that the numbers don't match. However, based on the analysis above, it seems likely that the 538 model generally must predict less parity than the Kenpom system, especially at the top. If nothing else, while these numbers are interesting to know (at least for me), this is not an exact science, and we are dealing with relative probabilities that we only in reality know within a factor of 10 or so.
While knowing how rare it would be for a tournament to happen when the favored teams wins in 63 straight games, I find that the more interesting question is that of the odds of a truly perfect bracket which would win the full tournament version of the Warren Buffet challenge. When I ran those numbers for the last 18 years, here is the result:
For reference, here are the actual odds for getting making the correct picks up to the Sweet 16 each year.
While the best possible odds to pick the winning bracket are in the "1 in a billion" range, the odds to correctly predict a real tournament are much, much worse. In fact, 2019 was the "most predictable" tournament with odds at 1 in over 3 trillion, which is about 500 times less likely than the most likely / chalk bracket. As for just getting up to the Sweet 16 fully correct, this year's odds of 1 in 540 million are by far the best of record (which explains why one person actually succeeded). In all previous years back to 2002, the odds were at least 1 in a billion, and have been as high as 1 in 1.8 trillion just last year.
Furthermore, the spread in this data set is clearly larger than in the previous set. In the "most likely / chalk" set, the difference between the most likely bracket and the least likely bracket was a factor of 100. When it comes to the real brackets, this difference is a factor of roughly 50,000. As a general rule, your odds of correctly predicting the result of all 63 NCAA Tournament games is about 1 in 100 trillion, with a very large variance. The odds can be as high as 1 in over 100 quadrillion for a year like 2011.
What is the source of this variance? It turns out to be simple statistical variation. Basically: luck. In some tournaments, a lot of big upsets are observed, and in others, there are very few. As anyone who has every participated in an NCAA office pool knows, upsets are unpredictable, and some upsets are way less predictable than other.
In order to explore this final avenue, I used the same Kenpom efficiency and probability data to set up a simple "Monte Carlo"-style simulation of the 2019 tournament. In general, I wanted to use this method to try to help me fill out my office pool bracket (which was very, very helpful). Considering that I need the exact same probabilities to run the simulation as I do to calculate the odds of a specific bracket occurring in the first place, I could essentially kill both birds with one stone.
I ran a total of 5000 simulation of the 2019 tournament and then calculated the distribution of the odds of a perfect actual bracket. The distribution of the odds is shown below, where in this case I plot the log10 value of the odds. What I mean by that is "9" would be equal to 1 in a billion (which has 9 zeros). "10" is 1 in 10 billion, "11" is one in 100 billion, etc. In addition, I superimposed the actual data from actual brackets from 2002 to 2019. Those results are shown below.
As you can see, the actual distribution of odds that I calculated from 2002 to 2019 tournaments matches very well with the distribution. So, I am confident in my claim that the observed variance is simply due to normal statistical variation. Furthermore, I am also confident that the main contributing factor in huge variance is the occurrence of "big" upsets. This is shown in the plot below, which correlates the number of observed "big" upsets to the ratio of the odds of the real bracket to the most likely bracket for that year. This eliminates the variance that is caused by the relative parity of the participating teams.
In this context, I define "big" as an upset where the odds for it to occur are roughly less than 30%. Practically speaking, this translate to a 1st round game where the difference in seed between the two teams in greater than 7 (4/13 upsets count, but 5/12 upsets do not), a 2nd round game where the seed differential is greater than 4, and any upset later in the tournament where the seed differential is greater than 2. In 2019, I count only 3 "big" upsets: UC Irvine over Kansas State, and Auburn over both UNC and Kentucky. That feels right to me.
In general, the correlation above is not superb, but I think it does prove my main point.
As a final note, my simulation of 5,000 different potential outcomes for the 2019 tournament did provide some other interesting observations. As for the extreme cases, the least chaotic bracket still had odds of around 1 in 30 billion., which is only a factor of 5 less likely than the most likely result. But, the craziest bracket in my particular simulation had odds of:
1 in 5,202,405,322,734,840,000,000 (or 1 in 5 sextillion!)
This value is roughly 500 times less likely than even the "random coin flip bracket" mentioned at the very top of this article. I think that might be a fun tournament to see play out, but we might need to wait 5000 years to see it.
Taking all of this data together, it finally occurred to me that there is perhaps a simpler mathematical way to look at this problem. Whether I am calculating the odds of the most likely / chalk bracket or the actual bracket, the way to calculate it is to multiple together the individual probabilities corresponding to the (real or projected) outcome of each contest. In the case of a big upset (like UMBC over Virgina) that probability is very small (about 1%), in the case of a "normal" 1-16 match-up that probability is close to one (~99%), and in an 8-9 seed match-up, that probability is close to 50%.
If we consider the entire set of 63 games (or 48, if we are just interested in the results of the 1st weekend), there is a fixed probability that is representative of the tournament as a whole. Mathematically, this works out to be the geometric average of the 63 (or 48 or whatever) individual probabilities. If we know (or calculate) this average probability (let's call it 'P'), the odds of that specific bracket occurring is then simply:
P^63
If this looks familiar, it should because it is essentially the same equation that we started with in the example of the coin flipping experiment. As it turns out, we actually can model the tournament in that way. The only trick is that the "coin" is a weighted one. In this example, a top loaded tournament with less parity tends to drive this probability up. A tournament with few upsets effectively does the same thing. In contrast, a lot of upsets drives this effective probability down.
In real tournaments, this effective overall probability is in the range of 53-63%. In the most likely / chalk brackets, the effective probability ranges from 65-70%. In both cases, the odds are ridiculously sensitive to small changes. Changing the the average probability by just 1% will change the overall odds by a factor of 2-3. This explains why small differences in the probability models can have such a large affect on the overall odds. The graph below shows this power law correlation to the odds.
Well, I think that I finally found the bottom of this particular stats rabbit hole and so that is all for now. Stay tuned for a bit more basketball math in the days ahead. I am not ready to turn my focus to football just yet.
Comments
Post a Comment