Over the past 4-5 years, I have been fascinated by the subject of probability and variance on both college football and basketball. Specifically, I became interested in how the probability of victory changes with the Vegas point spread (which is still the most reliable predictor of the outcome of individual games). I have written quite a bit about this in the past, so I will just summarize those findings briefly now.
There are several observations that I have made using a set of data from the "prediction tracker" website that covers data from 2004 through 2018. First of all, teams that are favored by "x" points tend to win by an average of "x" points. That data is plotted here:


There are several observations that I have made using a set of data from the "prediction tracker" website that covers data from 2004 through 2018. First of all, teams that are favored by "x" points tend to win by an average of "x" points. That data is plotted here:
Furthermore, you can calculate the variance (i.e. the standard deviation) of the final score difference as a function of each point spread. This value is a little above 10 points, with a fair amount of scatter, which increases a bit as the spread get larger. That data is shown here:
Knowing these two facts, it seems reasonable to check if the complete data set follows follows a Gaussian / Normal distribution. It turns out that it does, with an overall standard deviation of about 10.3:
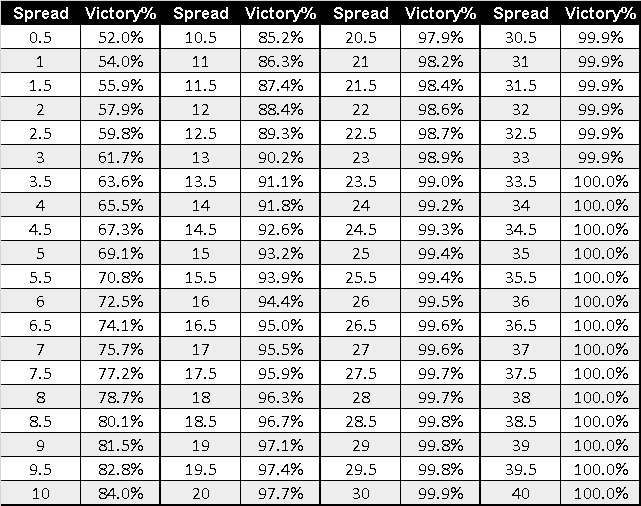
With this knowledge, we can use the mathematical property of the normal distribution to calculate the odds that the Vegas favorite will win the game (i.e. end up with a point differential above zero). If we plot all the data from the 15 year period on the same graph, we get the following correlation
In this case, I can use the standard deviation as a single fitting parameter. Through 2018, I get the best fit with a value of 10.04. I use this correlation for a whole lot of other calculations. For reference, here is that data in tabular form.
For me, this is all old news. But, let's stop and think for a bit about what this all means. The standard deviation of the final point difference in any given basketball game is just about exactly 10 points. That is a surprisingly huge number. This means that roughly two-thirds of the time (68% to be exact) the final margin will be within ten points in either direction of the final spread.
That also means that almost a third of the time, the final margin will be more than ten points from the spread. Even more shocking is that 5% of the time, the final margin will be more than 20 points from the spread in either direction.
So, if a team is a 5-point favorite, they have about a 70% chance to win the game straight up. But, there is also a 32% chance that they will either win by more than 15 points OR lose by more than 5. AND, there is a 5% chance that they will win by more than 25 points OR lose by more than 15. If we consider that a college basketball team plays 30-40 games a year, it is completely normal and expected that 1-2 times a year they will have a game with this extreme of an outcome. Keep this in mind the next time a Top 5 MSU team goes on the road to a conference bottom feeder and loses. It's just math and it literally happens to every team about once a year.
I have known all of this for a while, but the remaining question that nagged at me was, "why is the variance 10 points?" Well, I am happy to report that I now know the answer to that question as well, and as you will see, it is baked into the structure of the game of basketball itself.
The first piece of the puzzle came to me this year as I was tinkering with another set of statistics. Specifically, I was investigating the "Four Factors" which are effective field goal percentage (eFG%), turn-over rate, rebounding rate, and free throw rate. A good summary of those factors can be found here.
In my case, I put together a simple simulation of a game of basketball, or more specifically, of the number of points scored by one team. I set a fixed number of possessions and used the four factors to give me probabilities of the different things that could happen in each possession. The team could either turn it over, get a shot off, or wind up at the FT line. If the shot was missed, there was a fixed probability to get the offensive rebound, and I tracked that by simply giving the team an extra possession. I then used a random number generator to simulate series of games using different inputs for the four factors.
My initial purpose was to get a feel for how much a change in each factor would impact the average number of points scored by the team in question. The general conclusions were not too surprising: teams that shoot better, rebound, and don't turn it over tend to score more points. But what was surprising was the standard deviation in the data. I varied each factor over the entire range of values that was observed in the 2019 college season and ran each simulation 1000 times. For every value of all four factors, the standard deviation in total points scored was essentially the same:
7.5 points.
There was a bit of a range (7.3 to 7.9 points) but it was remarkably constant over all the input values. What is going on?
Then, at some point the truth hit me as to why this was the case. If you think about it, I was basically simulating a basketball game like it was a series of coin flips. The team had a fixed number of possessions (coin flips) and the odds of scoring (eFG%) were like the odds of get a head or a tail. If you were to flip a coin 10 times, of course you would expect to see 5 heads, but in reality this exact result will only happen about 25% of the time. 20% of the time, you would expect to get 4 (and the odds are the same for 6) and 12% of the time, you would get only 3 (or 7). Almost 11% of the time, you would expect to see anything from 0 to 2 or 8 to 10. There is natural variance in the result. It turns out basketball is essentially the same.
In mathematics, you can model a coin flip experiment using what is called the binomial distribution, and it has a well know standard deviation. It is defined as:

where 'n' is the number of flips and 'p' is the odds of a "successful" flip. Regarding 'p,' the average effective shooting percentage of a typical college team is right around 50%, so it really is just like a coin flip. Furthermore, the total number of shot attempts is usually a bit less than the total number of possession, which is on average is 68. Analysis has shown that eFG% and turn-over rate have a larger impact on scoring than rebounding and FTs, so I will ignore rebounding and FTs in order to simply things. If we consider the average turn-over rate is about 20%, that would knock the total shot attempts down to about 56. A quick spot check of the average shot attempts by a team (in this case Texas Tech) over the 2019 season gives an average of 53 shots a game, so a value in the mid-50s seems about right.
If I plug n=56 and p=0.5 into the equation above, the answer is 3.74. If we then realize that for each "successful coin flip" the team would be given 2 points (with eFG%, 3-pointers are rolled into the percentage) the standard deviation of points scored by one team in a game works out to be 2 times 3.74 or
7.48 points.
Bingo.
Furthermore, this value is not very sensitive to changes in 'n' or especially 'p'. If n goes down to 50, the resulting value is still 7.1 and if n is 62, it only goes up to 7.9. As for 'p,' the full range of eFG% typically observed in a given season is 40% to 60%. Over this range, 'p' goes only from 7.5 to 7.3, and the variance is actually at a maximum when p=0.5.
The final piece of the puzzle is the realization that when two teams are involved in a game, the point difference is essentially the same as subtracting two different normal distributions. The equation below shows how to calculate the standard deviation of the new distribution. In our case, both values of sigma are around 7.5.

If you plug 7.5 into the equation above, the standard deviation of the new distribution is the square root of 2 times 7.5 squared or:
10.37 points
which is, of course, almost dead on what I observe.
Nice.
So, what does all this mean? In purely mathematical terms, it means that simply due to normal statistical variance the difference between a "good" day and a "bad" day offensively for a team can be +/- 7 points (one standard deviation). It also means that the difference between a really good day and a really bad day can be +/- 15 points (two standard deviations). It also suggests that each team is likely to have at roughly 1 really good day and one really bad day a year.
If you study these number a bit too much, it is easy to fall into the trap of thinking that basketball really is just random. Maybe there is no such thing as free will and maybe we are all just living in a simulation or the matrix. Maybe none of it means anything. Maybe it is all just like rolling dice. You might as well just go to the casino...
But, I don't believe that.
College basketball is NOT just a game of rolling dice or flipping coins. It is a game of skill played by super athletic, 18-22 year-old with free will who live in the real world. Granted, sometimes those kids get a little dinged up; sometimes they are a little under the weather; sometimes they get into foul trouble; sometimes they stay up too late; sometimes their get into an argument with their girlfriends; sometimes they have a friend or a family member with a serious illness; and sometimes they just miss shots. ALL of these things matter. ALL of things things contribute to the variance that we see in reality.
But beyond that, it is my belief that the difference between a very good team and a championship team is the ability to beat the odds. A lot of that, or perhaps most of that comes down to real basketball stuff. Great coaches draw up plays to get higher percentage shots (or prevent the other team from getting high percentage shots). Great players make the great pass, block the shot, fight for the loose ball or the rebound, or hit the clutch shot when the game on the line. Yes, sometimes the odds get you, but ultimately, as the French scientist Louis Pasteur famously said, "chance favors the prepared mind," and as Dr. Green and White likes to say, "probability is not destiny."
One way to potentially measure that is simply to look at certain team's ability to beat the spread. From a vary high level view, this gives us an idea at which teams are the best at beating the odds. I found some data back to 2004 and it is interesting to see which High Major teams are at the top of the list:
Villanova : 291-228-7 (55.3%)
Virginia: 254-208-9 (53.9%)
Xavier: 282-230-13 (53.7%)
N Carolina: 302-249-13 (53.5%)
Texas A&M: 231-204-6 (52.4%)
Michigan St: 282-246-11 (52.3%)
Yeah, I think that checks out.
That is all for today. Stay tuned for more stats on the NCAA tournament in the coming days. Enjoy, and Go Green.
Comments
Post a Comment