This are truly strange times that we are living in. While the NCAA Tournament was officially cancelled, it is still fun to imagine what could have been had the world not been plunged into the current COVID-19 pandemic crisis. Back on Selection Sunday, I presented an NCAA Tournament bracket that might have been close to the real one. If parallel universes due, in fact, exist, then perhaps that tournament is actually playing out somewhere. At least someone is having fun...
Last year around this time, I developed a new analytical strategy for analyzing the NCAA Tournament bracket, and it did a very nice job in helping me make my picks. I was looking forward to trying it out again on the 2020 bracket. While the we don't have a real bracket to analyze, the "parallel universe" bracket is a reasonable substitute. As a part of my own personal mourning process, I decided to also my new methodology to analyze the parallel universe bracket to see what conclusions I would have drawn. If nothing else, it is good practice as we look forward to March Madness' return in 2021.
As for the methodology, I basically rely on a combination of win probabilities derived from Kenpom data and historical upset trends. As it turns out, these two factors are actually related. Using Kenpom data, I was able to simulate my fake 2020 tournament 5,000 times, which gives a good set of statistics that form the basis of my analysis.
A "Typical" Tournament Bracket
The best place to start with bracket analysis is with the standard upset rate for the usual seed pair combinations. For example, the upset rate for a No. 5 / No. 12 game is well-know to be about 33%. What is less well-known is that the reason for this is due to the Vegas spread. For a typical No. 5 / No. 12 match-up, the spread is typically around 4.5 points, which is consistent with a 33% upset rate. The same math applies to essentially all seed combinations, as I show in the plot below.


The lower seeds in this region are mostly average, with a few notable exceptions. Virginia is a very weak No. 7 seed, while Texas Tech projects as a very strong No. 10 seed. Also, the No. 12 seeds and below are all relatively weak.
So, at a first glance, this is clearly Kansas' region to lose. MSU would project to likely have a smooth first round game against Ohio, but the potential second round game with Texas Tech could be a problem. However, if MSU were to survive that, the Sweet 16 round game looks manageable and a show-down with Kansas in the Regional Final is a good bet. Also, based on the weakness of the No. 12 seeds and below, no major upset would be expected.
The second set of data that I like to employ in my bracket analysis is the results of the Monte Carlo simulation of the tournament. The data table for the Midwest is shown below:

There is clearly a lot going on here. The first few data columns show the Kenpom efficiency for each team as well as the relative efficiency ("KP Rel") compared to the historical average for that seed. The next step of columns show the probability of advancing in the tournament per round. Finally, the last set of columns shows the relative probability of advancing compared to the historically average seed.
As an example, this data suggests that with this specific draw, MSU would have roughly a 19 percent chance to make the Final Four and a six percent chance to win the National Title. As suggested above, MSU's odds to win in the first round is better than the average No. 2 seed, but the odds to advance farther than that are a bit below average (likely due to Texas Tech and later Kansas looming). In general, if this bracket or a similar one were to have actually happened... it would not have been a great draw for MSU.
South Region
A similar analysis can also be performed on the remaining three regions. In the South, the Kenpom comparison plot is shown here:


As we look at the top part of the Region, it is appears quite weak. Of the top five seed, only Duke is above average, and picking Duke to win the Region (based on Kenpom data) looks like a potentially smart move. As for other teams that are above average and could make some noise, Michigan is a strong No. 6 seed and Florida looks like a strong No. 9 seed.
Ironically, this also seems to be a tough draw for Michigan. The potential match-up with Duke is a bad deal for them, but if they were to have survived that game, their odds to advance are above average. Also notable is that Baylor has both a surprisingly tough first round opponent in Boston, but also a potentially tricky second round match-up with Florida. Baylor looks like a vulnerable No. 1 seed.
West Region
Our analysis swings next to the West Region, where the Kenpom comparison plot and simulation table are shown below


Similar to the South region, the majority of the top seeds in the West appear to be relatively weak, historically. The strong teams in the West appear to be No. 5 Ohio State, No. 6 West Virginia, No. 8 Houston, and No. 9 Rutgers. Gonzaga would be on upset alert in Round 2. Also, Northern Colorado is a relatively strong No. 13 seed and they would just happen to be paired with a relatively weak No. 4 seed in Oregon. Hmmmmm.
East Region
Finally, the Kenpom comparison plot and simulation table for the East Region are shown below:


If we thought the top seeds in the South and West were weak, the East seems to be even a bit worse. In this case the top six seeds and all relatively weak. In fact, the only above average teams appear to be No. 7 seed Arizona, which ever No. 12 seed wins the play-in First Four game (Stanford or Cincinnati), the No. 15 seed, and the No. 16 Nicholls State. At a glance, this is very bad for No. 5 seed Auburn and likely No. 2 seed Florida State.
Making the Picks
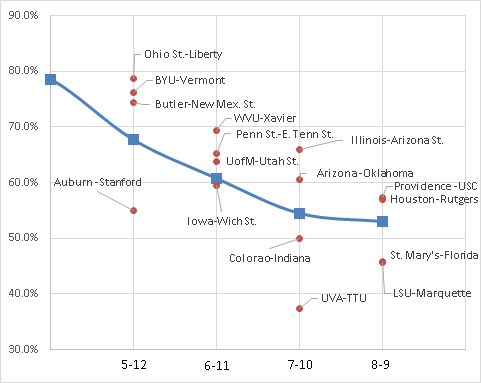
While looking at each individual region certainly is helpful, it is also very informative to look at the individual match-ups on a round-by-round basis. To support this analysis, I plotted the projected odds for each of the first round match-ups compared to the historical odds of that pairing. The graphs below are for the first round match-ups.


With all of this data in hand, it is time to start making some picks, starting with the first round. As noted above, the simulation suggests that it is likely that there will be a slightly below average number of upsets in the first round. As I consult both the graphs and table above, there are five potential first round upsets that trigger my upset alert flag:
No. 10 Texas Tech over No. 7 Virginia
No. 10 Indiana over No. 7 Colorado
No. 12 Stanford / Cincinnati over No. 5 Auburn
No. 9 Marquette over No. 8 LSU
No. 9 Florida over No. 9 Saint Mary's
This gives us five upsets right off the bat, including two No. 8 seeds and two No. 7 seeds. However, the selection of any addition upsets is a little trickier. It is tempting to take No. 11 Wichita State to beat No. 6 Iowa, but the Hawkeye are also a prime candidate to upset No. 3 Villanova in the next round, so I would be hesitant to knock Iowa out.
Based on historical numbers, there are likely to one more upset on the No. 4 and No. 5 seed lines. As for a "big" first round upset, the data suggests No. 14 North Dakota State might have a shot at No. 3 Kentucky, but I would not actually make that pick. However, I would likely be bold enough to pick:
No. 13 Northern Colorado over No. 4 Oregon
As for the remaining first round upsets, I would just do one more, just to be a jerk:
No. 11 Utah State over No. 6 Michigan
In my defense, this is the second most likely No. 6 seed upset.
Second Round Upsets
Moving on to the second round, in this case, my upset alert algorithm pings on several upsets:
No. 5 Butler over No. 4 Wisconsin
No. 6 Penn State over No. 3 Seton Hall
No. 7 Arizona over No. 2 Florida State
No. 5 BYU over No. 4 Louisville
No. 6 Iowa over No. 3 Villanova
In addition, if the Kenpom projections are correct, the following "seed upset" would actually not be an upset according to Vegas:
No. 6 West Virginia over No. 3 Kentucky
It would also be tempting to knock out a No. 1 seed in the second round and the most likely one would be to take No. 8 Houston over No. 1 Gonzaga in the West. However, based on the fact that we have already identified six second round upsets, I would stand pat with the six upsets listed above.
The Sweet Sixteen
Based on what we have so far, the tournament would be down to the following second weekend match ups
No 1. Kansas vs. No. 5 BYU
No. 2 MSU vs. No. 6 Iowa
No. 1 Baylor vs. No. 5 Butler
No. 2 Creighton vs. No. 3 Duke
No. 1 Gonzaga vs. No. 5 Ohio State
No. 2 San Diego State vs. No. 6 West Virginia
No. 1 Dayton vs. No. 4 Maryland
No. 6 Penn State vs. No. 7 Arizona
If I just use my upset alert algorithm, it automatically flags two upsets:
No. 3 Duke over No. 2 Creighton and
No. 7 Arizona over No. 6 Penn State
I would also seem like the appropriate time to knock out at least one No. 1 seed. Based on the tables above, both Dayton and Gonzaga appear to have the best odds to get upset, and I will go with:
No. 5 Ohio State over No. 1 Gonzaga
Although I could certainly see the argument to take Maryland over Dayton as well.
The Elite Eight and Beyond
Considering these results, we are left with
No. 1 Kansas vs. No. 2 MSU
No. 1 Baylor vs. No. 3 Duke
No. 2 San Diego State vs. No. 5 Ohio State
No. 1 Dayton vs. No 7 Arizona
My upset alert algorithm would take Duke over Baylor, but the other games are judgment calls. As much as it pains me, the smart move is to take Kansas over MSU. Also, it is a big surprise to me that San Diego State actually has the best odds to make the Final Four of any of the No. 2 seeds, so it makes sense to advance them as well. As for the East Region, the Final Four almost always has a bit of chaos, and that suggests to me to take Arizona.
However, I could easily be convinced to reverse those two picks and take Dayton and Ohio State into the Final Four. This analysis leans heavily on the fact that Kenpom has been high on both the Buckeyes and Wildcats all year. Arizona certainly limped down the stretch, and I am not sure exactly why. Ohio State, in contrast, seems to be on the upswing. I would have certainly have investigated this more if were a real exercise.
In this scenario, I would then have the following Final Four picks
No. 1 Kansas over No. 7 Arizona
No. 3 Duke over No. 2 San Diego State
and then
No. 1 Kansas over No. 3 Duke for the National Title
While this would be a truly awful final game to watch, it is where my analysis takes me.
So, in the parallel universe, this is how I would have made my picks. But, how would the tournament actually have turned out? While we certainly don't know, as a final exercise to complete my own personal coping with March Madness withdrawal, I am planning to simulate the entire tournament and report the results round-by-round.
Stay tuned. If you are an MSU fan, I am pretty sure that you will like the result. :)
Last year around this time, I developed a new analytical strategy for analyzing the NCAA Tournament bracket, and it did a very nice job in helping me make my picks. I was looking forward to trying it out again on the 2020 bracket. While the we don't have a real bracket to analyze, the "parallel universe" bracket is a reasonable substitute. As a part of my own personal mourning process, I decided to also my new methodology to analyze the parallel universe bracket to see what conclusions I would have drawn. If nothing else, it is good practice as we look forward to March Madness' return in 2021.
As for the methodology, I basically rely on a combination of win probabilities derived from Kenpom data and historical upset trends. As it turns out, these two factors are actually related. Using Kenpom data, I was able to simulate my fake 2020 tournament 5,000 times, which gives a good set of statistics that form the basis of my analysis.
A "Typical" Tournament Bracket
The best place to start with bracket analysis is with the standard upset rate for the usual seed pair combinations. For example, the upset rate for a No. 5 / No. 12 game is well-know to be about 33%. What is less well-known is that the reason for this is due to the Vegas spread. For a typical No. 5 / No. 12 match-up, the spread is typically around 4.5 points, which is consistent with a 33% upset rate. The same math applies to essentially all seed combinations, as I show in the plot below.
While there are some notable small deviations from this trend, in general this is a very robust predictor.
Another surprising observation about tournament upsets is that on average all tournaments behave essentially the same. Based on my analysis, all brackets have the potential for chaos (or order), but there is not that much difference from year to year in how predictable a given bracket will be. I say this based on the following two graphs
The first graph shows the average number of upsets per year as a function of round and the second graph is the standard deviation of the number of upsets by round. There are three different data sets plotted. In green is data from actual tournament play from 1985 until 2019. In red is data derived from simulations of all tournaments in the Kenpom data era (2002 to 2019).
As you can see there is very good agreement between the number of upsets per round in the simulations and in reality. Perhaps more important, the variance (standard deviation) is also similar. This implies that the simulations are accurately capturing the natural variance of the real tournament.
In blue on the graph is the data from the simulations of my parallel universe 2020 bracket. As we can see, the number of upsets predicted tracks very well with the historical simulations and reality. But, there are a few subtle and important differences. First, the total number of upsets in the entire tournament in 2020 is expected to be right at the historical average (19 ± 3.3). In addition, the same is true for the number of upsets in the Sweet 16 round and beyond.
However, the behavior of the first and second rounds looks slightly different. The simulation suggests that slightly fewer upset are expected in the first round (8.2 vs. 8.6), while slightly more upsets (5.4 vs. 5.1) are expected in the second round. This is an interesting wrinkle.
Of more practical value to filling out an actual bracket is also just the raw number of average upsets to expect in each round. There are usually around eight in the first round, five to six in the second round, two or three in the Sweet 16 round, one or two in the Region Final Round, and then once teams get to the Final Four, the higher seeds usually win. As for other rules of thumb, I always consider the following:
- In the first round the No. 8 / No. 9 games are a coin flip, you would expect three upsets between the No. 6 and No. 7 seeds, two more upsets between the No. 4 and No. 5 seeds, and maybe one "major" upset of a No. 1, No. 2, or No. 3-seed. Although, my analysis suggests that it is never a good idea to pick a first round upset of a No. 1, No. 2, or No. 3-seed. They are simply not predictable on an individual game basis.
- In the second round, No. 1 seeds lose about once every two years. As for the No. 2, No. 3, and No. 4 seeds, one would expect to see four total upsets in that group in a year, and they are oddly pretty evenly distributed between those three seeds, historically.
- In the Sweet 16 round, a little over half (55 percent) of No. 1 seeds make the Regional Final, while a little less than half (42 percent) of No. 2 seeds make it, and usually only one No. 3 seed per year gets that far.
- As for the Final Four, while it is tempting to take something like three No. 1 seeds, that rarely happens (only 13 percent of the time). History shows that one No. 1 seed almost always makes it. Two No. 1 seeds only happens half the time. The average seed of the third best Final Four team is 3.0, while the lowest average seed is an astounding 5.7 and is no better than a No. 4 seed in over half of all tournaments. So an "average" Final Four is a No. 1 seed, a No. 1 or No. 2 seed, a No 3 seed, and something lower than a No. 4 seed.
With this knowledge in hand, it's time to dig into each Region and to start to make some (fake) predictions.
Midwest Region
When analyzing a given NCAA Tournament Region, there are a couple of factors that I like to look at. First, I find it useful to compare the Kenpom adjusted efficiency of each team in the region to the historical average efficiency of that seed. The graph below shows this comparison for the 2020 Parallel Universe Midwest Region.

For these plots, the blue marker is the historical average for that seed and the error bars represent the standard deviation. At a glance, this plot shows the relative strengths and weaknesses of the region as a whole. Kenpom data suggests that Kansas is, by far, the best team in the tournament and the strongest No. 1 seed. Based on historical numbers, MSU is a relatively weak No. 2 seed, while Villanova is a an even weaker No. 3 seed.The lower seeds in this region are mostly average, with a few notable exceptions. Virginia is a very weak No. 7 seed, while Texas Tech projects as a very strong No. 10 seed. Also, the No. 12 seeds and below are all relatively weak.
So, at a first glance, this is clearly Kansas' region to lose. MSU would project to likely have a smooth first round game against Ohio, but the potential second round game with Texas Tech could be a problem. However, if MSU were to survive that, the Sweet 16 round game looks manageable and a show-down with Kansas in the Regional Final is a good bet. Also, based on the weakness of the No. 12 seeds and below, no major upset would be expected.
The second set of data that I like to employ in my bracket analysis is the results of the Monte Carlo simulation of the tournament. The data table for the Midwest is shown below:
There is clearly a lot going on here. The first few data columns show the Kenpom efficiency for each team as well as the relative efficiency ("KP Rel") compared to the historical average for that seed. The next step of columns show the probability of advancing in the tournament per round. Finally, the last set of columns shows the relative probability of advancing compared to the historically average seed.
As an example, this data suggests that with this specific draw, MSU would have roughly a 19 percent chance to make the Final Four and a six percent chance to win the National Title. As suggested above, MSU's odds to win in the first round is better than the average No. 2 seed, but the odds to advance farther than that are a bit below average (likely due to Texas Tech and later Kansas looming). In general, if this bracket or a similar one were to have actually happened... it would not have been a great draw for MSU.
South Region
A similar analysis can also be performed on the remaining three regions. In the South, the Kenpom comparison plot is shown here:
In addition, the simulation data table for the South Region is shown here:
Ironically, this also seems to be a tough draw for Michigan. The potential match-up with Duke is a bad deal for them, but if they were to have survived that game, their odds to advance are above average. Also notable is that Baylor has both a surprisingly tough first round opponent in Boston, but also a potentially tricky second round match-up with Florida. Baylor looks like a vulnerable No. 1 seed.
West Region
Our analysis swings next to the West Region, where the Kenpom comparison plot and simulation table are shown below
East Region
Finally, the Kenpom comparison plot and simulation table for the East Region are shown below:
Making the Picks
While looking at each individual region certainly is helpful, it is also very informative to look at the individual match-ups on a round-by-round basis. To support this analysis, I plotted the projected odds for each of the first round match-ups compared to the historical odds of that pairing. The graphs below are for the first round match-ups.
For the potential second round games and beyond, the plots are shown below:
These plot, in large part summarize many of the observations made above, but I find this visualization helpful. As for the selection of individual upsets, I have developed a method to rank the likelihood of each potential upset in the tournament.
I went down a huge rabbit hole on this topic last year, and the mathematical details are not that important (but if you are curious, I explain in painful detail here). Suffice it to say that the basic idea is to compare the odds of a given match-up to the historical odds for that seed pairing. The deviation of these odds from the average will trigger an "upset alert" if the deviation is over a certain threshold, which differs based on each seed pair and is related to the normal distribution. Anyway, I ran this analysis on the full tournament and made a ranked list of the Top 25 possible upsets in our parallel universe bracket, as shown below.
First Round Upsets
With all of this data in hand, it is time to start making some picks, starting with the first round. As noted above, the simulation suggests that it is likely that there will be a slightly below average number of upsets in the first round. As I consult both the graphs and table above, there are five potential first round upsets that trigger my upset alert flag:
No. 10 Texas Tech over No. 7 Virginia
No. 10 Indiana over No. 7 Colorado
No. 12 Stanford / Cincinnati over No. 5 Auburn
No. 9 Marquette over No. 8 LSU
No. 9 Florida over No. 9 Saint Mary's
This gives us five upsets right off the bat, including two No. 8 seeds and two No. 7 seeds. However, the selection of any addition upsets is a little trickier. It is tempting to take No. 11 Wichita State to beat No. 6 Iowa, but the Hawkeye are also a prime candidate to upset No. 3 Villanova in the next round, so I would be hesitant to knock Iowa out.
Based on historical numbers, there are likely to one more upset on the No. 4 and No. 5 seed lines. As for a "big" first round upset, the data suggests No. 14 North Dakota State might have a shot at No. 3 Kentucky, but I would not actually make that pick. However, I would likely be bold enough to pick:
No. 13 Northern Colorado over No. 4 Oregon
As for the remaining first round upsets, I would just do one more, just to be a jerk:
No. 11 Utah State over No. 6 Michigan
In my defense, this is the second most likely No. 6 seed upset.
Second Round Upsets
Moving on to the second round, in this case, my upset alert algorithm pings on several upsets:
No. 5 Butler over No. 4 Wisconsin
No. 6 Penn State over No. 3 Seton Hall
No. 7 Arizona over No. 2 Florida State
No. 5 BYU over No. 4 Louisville
No. 6 Iowa over No. 3 Villanova
In addition, if the Kenpom projections are correct, the following "seed upset" would actually not be an upset according to Vegas:
No. 6 West Virginia over No. 3 Kentucky
It would also be tempting to knock out a No. 1 seed in the second round and the most likely one would be to take No. 8 Houston over No. 1 Gonzaga in the West. However, based on the fact that we have already identified six second round upsets, I would stand pat with the six upsets listed above.
The Sweet Sixteen
Based on what we have so far, the tournament would be down to the following second weekend match ups
No 1. Kansas vs. No. 5 BYU
No. 2 MSU vs. No. 6 Iowa
No. 1 Baylor vs. No. 5 Butler
No. 2 Creighton vs. No. 3 Duke
No. 1 Gonzaga vs. No. 5 Ohio State
No. 2 San Diego State vs. No. 6 West Virginia
No. 1 Dayton vs. No. 4 Maryland
No. 6 Penn State vs. No. 7 Arizona
If I just use my upset alert algorithm, it automatically flags two upsets:
No. 3 Duke over No. 2 Creighton and
No. 7 Arizona over No. 6 Penn State
I would also seem like the appropriate time to knock out at least one No. 1 seed. Based on the tables above, both Dayton and Gonzaga appear to have the best odds to get upset, and I will go with:
No. 5 Ohio State over No. 1 Gonzaga
Although I could certainly see the argument to take Maryland over Dayton as well.
The Elite Eight and Beyond
Considering these results, we are left with
No. 1 Kansas vs. No. 2 MSU
No. 1 Baylor vs. No. 3 Duke
No. 2 San Diego State vs. No. 5 Ohio State
No. 1 Dayton vs. No 7 Arizona
My upset alert algorithm would take Duke over Baylor, but the other games are judgment calls. As much as it pains me, the smart move is to take Kansas over MSU. Also, it is a big surprise to me that San Diego State actually has the best odds to make the Final Four of any of the No. 2 seeds, so it makes sense to advance them as well. As for the East Region, the Final Four almost always has a bit of chaos, and that suggests to me to take Arizona.
However, I could easily be convinced to reverse those two picks and take Dayton and Ohio State into the Final Four. This analysis leans heavily on the fact that Kenpom has been high on both the Buckeyes and Wildcats all year. Arizona certainly limped down the stretch, and I am not sure exactly why. Ohio State, in contrast, seems to be on the upswing. I would have certainly have investigated this more if were a real exercise.
In this scenario, I would then have the following Final Four picks
No. 1 Kansas over No. 7 Arizona
No. 3 Duke over No. 2 San Diego State
and then
No. 1 Kansas over No. 3 Duke for the National Title
While this would be a truly awful final game to watch, it is where my analysis takes me.
So, in the parallel universe, this is how I would have made my picks. But, how would the tournament actually have turned out? While we certainly don't know, as a final exercise to complete my own personal coping with March Madness withdrawal, I am planning to simulate the entire tournament and report the results round-by-round.
Stay tuned. If you are an MSU fan, I am pretty sure that you will like the result. :)
Comments
Post a Comment