With MSU's basketball season on a (hopefully) short pause due to COVID-19, I have been thinking a lot about the NCAA Tournament. One topic, of course, is whether MSU will actually be playing in said tournament in March. For today, I will give a simple answer to that question: if the Spartans start playing better and can approach their potential soon, then yes, I think that they will make the tournament. If they do not, then they won't.
As for today, I have some thoughts related to the structure of the actual tournament itself. As most sports fans know, the current NCAA Men's Basketball Tournament consists of 68 total teams, 32 of which are conference champion automatic qualifiers and 36 of which are "at-large" teams selected by the Selection Committee.
However, the tournament has not always been the same size that it is today. The current structure has only been in place since 2011. From 2001 to 2010, the tournament consisted of only 65 teams, which was an increase from the much more mathematically pleasing number of 64 teams from 1985 to 2000.
From 1980 to 1985, the Tournament field grew from 48 teams and then to 52 teams in 1983 and 53 teams in 1984. When Magic Johnson cut down the nets for the Spartans in 1979, the tournament had just instituted seeding and had expanded from 32 to 40 teams. Back in 1951, the tournament consisted of only 16 teams. The number fluctuated between 22 and 25 teams throughout the 1950s through the mid 1970s.
As we think about the upcoming 2021 Tournament, the current plan is to go forward with current 68 team format. However, some coaches or media members have suggested that the NCAA could consider tournaments of different sizes. ESPN's bracketology expert, Joe Lunardi, has been tinkering with both a 16-team and a 48-team bracket. In addition, Duke Coach Mike Krzyzewski proposed back in September that all Division 1 teams should make the NCAA tournament in 2021.
These discussions caused me to ask the following question:
- What impact would changing the size of the NCAA tournament make on the eventual result?
I decided to dip into my bag of mathematical tricks in an attempt to answer this question.
Methodology
The first step was to define a set of tournaments of different sizes and make-ups that could be compared on an apple-to-apples basis. In order to make the selection and seeding of teams straightforward, I used Ken Pomeroy's rankings on January 1st to define both the best team in each conference (to define the teams earning an automatic bid) as well as the "best" at-large teams and the seeding, from the No. 1 overall seed to the lowest seeded team.
I settled on six total single-elimination formats to examine, which are summarized below:
16-Team Tournament
In this case, I envision a process where the champion of each of the six high-major conferences (ACC, Big 12, Big Ten, Big East, SEC, and Pac-12) gets an automatic bid and the remaining 10 teams are the at-large bids which I selected using the highest ranked remaining teams in Kenpom. Since 16 is a factor of two, the Tournament consists of four even rounds with no byes or play-in games.
48-Team Tournament
Here, I gave the champion of all 32 conferences as automatic bids, which leaves only 16 additional bids for at large teams. In this case, the top 16 total teams (seeds No. 1 to No. 4) all receive a first round bye. The first round consists of 16 total games which reduces the field to an even 32 teams. From there, a total of five rounds are played to reduce the field to the champion.
68-Team Tournament
This is the current format of the Tournament. There are 32 automatic bids and 36 at-large bids. I also used the current First Four structure where the bottom four teams overall face off to become a pair of No. 16 seeds and the bottom four at-large teams face off to enter the Tournament as a No. 11 or No. 12 seed.
68-Team Tournament of Top Teams
I decided to explore a variation on the current format where there are no automatic bids and the tournament is comprised of just the top 68 ranked teams in Kenpom. I kept the same basic structure as the current tournament in which the bottom four teams as well as the teams ranked No. 43 to No. 47 overall play in the First Four.
128-Team Tournament
In this case, the number of at-large bids is greatly expanded to 96 teams. As 128 is also a factor of two, the tournament is easily structured in seven total rounds with no byes or play-in games.
357-Team Tournament
This is the full-monty-let-them-all-play version of the tournament where every team ranked by Kenpom gets into the Big Dance. The top 155 teams get a first round bye, while the bottom 202 teams face off in 101 first round games. This pares the field down to 256 teams, which is once again a factor of two. From there eight rounds with no additional byes are needed to decide the champion.
When placing the teams into each bracket, no consideration was made for geography or potential rematches. I simply used the Kenpom rankings to define the "s-curve" where in all cases the strongest team is matched up against the weakest team remaining, if the favored teams all win.
In order to simulate the results of each tournament I used a standard Monte Carlo method. I used the Kenpom ratings for each team to generate a projected point spread and win probability. I then used a random number generator to select the winner of each game, all the way to the championship game. I simulated each tournament 50,000 times.
Does Size Matter?
The overall results of this series of simulations is shown below in Figure 1, which gives the odds for each of the top 16 teams in the country to win the National Championship in each of the six test cases mentioned above.
|
| Figure 1: Odds for the top 16 teams in the country to win the national title in six different sized tournaments. |
I did not bother to name any of the teams in Figure 1 because the actual identity of each team really does not matter. These teams are simply a representative group of teams with decreasing relative strength. The source data is simply a snapshot of how good that series of teams was on one specific day.
Just for reference, the top four seeds on that specific day were Gonzaga, Baylor, Villanova, and Wisconsin. The current top four is a little different now and the efficiency margins have also changed. As such, the raw percentages are not that important. The key point of Figure 1 is how the odds change as the size of the tournament changes.
The obvious take-home message is this: the size and structure of the tournament does not make a big difference in the odds of each team to win the tournament.
For the smaller (16- and 48-team) tournaments, the stronger teams have slightly better odds than they do in the larger tournament. But, this difference is less than two percentage points (24.6 percent versus 23.3 percent) for the No. 1 overall seed and less for the weaker teams. As the tournament increases in size from 68 to 128 to 357 teams, the odds for each of the top 16 teams to cut down the nets does not change significantly
In general, I found this result to be rather surprising. I expected that a larger tournament field would inject significantly more chaos in the mix, resulting in a depression of the odds for the top teams. However, this is not the case. The next question to ask is: why?
What Is Going On?
In order to better understand this result, it is helpful to look in more detail at what is happening round-by-round in the different tournaments. From here out, I will focus on the No. 1 overall seed only, but the trends generally hold for all teams. Figure 2 below shows the odds for this team to advance past each round in five of the test case tournaments.
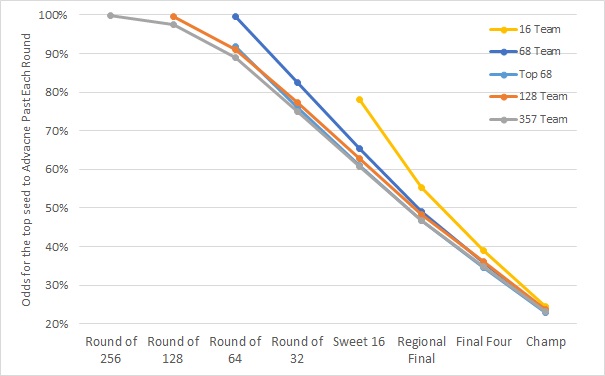 |
| Figure 2: Odds for the No. 1 overall seed to advanced past each round for five of the test case tournaments. |
As the tournament adds additional rounds, each team has more opportunities to lose. As Figure 2 shows, if the tournament were to be expanded to 128 or 357 teams, the No. 1 overall seed would suffer a noticeable number of upsets in the Round of 64, which is the starting point for the No. 1 overall seed in the current format.
In the current format, the No. 1 overall seed in this example would be expected to win in the Round of 64 about 99.6 percent of the time. If the tournament were to expand to 128 team, the win probability drops to 91 percent. If all Division 1 teams are invited, that probability drops to 89 percent.
The reason for this is due to the relative strength of the No. 1 overall seed's opponent in each case. In the current 68-team format, a typical No. 16 seed would be an automatic qualifier ranked around No. 200 in Kenpom. When the one round is added (the 128-team tournament), the No. 1 overall team would face a team as strong as a typical No. 16 seed one round earlier in the Round of 128. In the Round of 64, the opponent would be stronger (around No. 64 in Kenpom) and thus the odds of an update would increase.
In the case of the 357-team tournament, the opponent for the No. 1 overall seed in the Round of 64 would be roughly the same as in the 128-team tournament. But, the odds of advancing past this round are slightly lower due to a need to face a tougher opponent in the Round of 128 (because the weaker teams likely got knocked out of the tournament in the previous rounds).
However, as the tournament progress to the later rounds, the lines begin to converge. It appears that as the tournament size increases, the average opponent strength tends to decrease as the tournament moves into the later rounds.
In order to visualize this effect, it is helpful to plot the probability of the No. 1 overall seed to win each specific game in each round. This is essentially equivalent to estimating the average point spread that the No. 1 overall seed would face in each round. That data is summarized in Figure 3.
 |
| Figure 3: Average odds for the No. 1 overall seed to win each specific game in each round |
Similar to the discussion above, the No. 1 overall seed has a very high probability to win the first game in the tournament where automatic bids are in play (larger than 16 teams). The probability then starts to drop.
The most interesting comparison is the one between the 68-team tournament and the two larger tournaments from the Round of 32 on. At this point in the tournament, the weaker automatic bid teams have generally been eliminated and it is easier to compare the tournaments to each other directly.
For the standard 64-team tournament, the No. 1 overall seed will face either a No. 8 or a No. 9 seed in the Round of 32. In the larger tournaments, the s-curve would place the same two teams on the path to face that No. 1 overall seed, but those No. 8 and No. 9 seeds would first need to win a game or two to get there. If one or both of those teams gets upset in a prior round, the path for the No. 1 overall seed gets slightly easier, which is why the odds for the No. 1 overall seed to advance go up slightly.
The same is true for the later rounds. In a bigger tournament, the No. 1 overall seed has more opportunities to lose, but so does all the other teams. The depression in the odds due to playing more games is almost exactly offset by the odds that the path to the title will be easier.
That said, this effect does not quite offset as the Tournament becomes small enough. The odds for the all of the top 16 teams are slightly better in the 16-team tournament. The odds for the 48-team tournament are similar because in the case that I considered there are only 16 at large bids and a disproportionately large number of weaker teams in the field.
In this case, playing fewer games does boost the odds of those top 16 teams slightly (by a percentage point or two for each team). But another way to look at it is that there are simply fewer teams available to actually win the tournament. In the larger tournaments, 10 to 14 percent of the time, a team outside of the Top 16 teams will win the National Title (which is also consistent with the history of the real Tournament since 1979). But, if only 16 total teams are invited, that 10 to 14 percent of probability needs to go somewhere. It seems to essentially get spilt amongst the entire field.
The general takeaway from this analysis that I have is the following. While the structure of the tournament is certainly important, it does not make much of a difference in the actual outcome. What does matter, it how good the teams actually are relative to each other.
In this example, there are two teams (Gonzaga and Baylor) who graded out as much better than the rest of the field. As a result, the odds of one of those two teams winning the National Title is just over 40 percent, no matter which of the six tournament formats are used. That said, that still implies that there is a 60 percent chance that some other team wins the Title.
So, a team like Gonzaga and Baylor have very good odds and would likely win a seven-game series against most teams in the field. But, in order to win the National Title in college basketball they need to bring their A-game in each of the single elimination games in the Big Dance. Chaos or madness is still very much a possibility... just the way we like it.


Comments
Post a Comment