It always feels good to beat your rival. It feels better when you beat them at home by double digits, and it feels even better when you can say that you have now beaten them 11 of the last 16 times. It is a good time in history to be a fan of the Michigan State Spartans basketball team.
My usual schedule is to provide an update on Michigan State's expected win total, conference title odds, and Big Ten Tournament prospects about once a week. However, it seems fair to provide a quick update today on the impact the Spartans' big win as well as to take a sneak peak at the coming week, which is perhaps bigger than you might think.
Let's start with a lightning round version of my typical odds update.
Updated Big Ten Odds
With the win over the Wolverines on Saturday and the other weekend action, here are the updated odds for each team to or share the Big Ten regular season title.
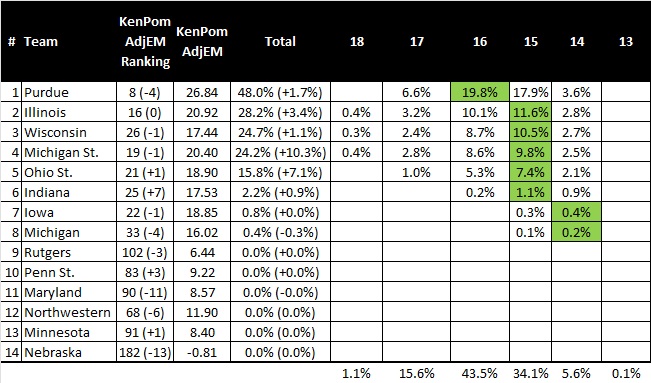 |
| Table 1: Updated odds to win or share the Big Ten title and the win distributions for those winning teams as of Jan. 31. |
The Spartans clearly got a small boost based on the big win on Saturday, but title odds of 17 percent are still less than five-to-one. That said, I still feel that there is room for optimism. The wildcard remains the open question of whether or not the game against the Wolverines in Ann Arbor will be rescheduled or not.
Mathematically, playing 20 Big Ten games helps Michigan State, as a record of 16-4 is now the most likely record of the eventual champion(s). If the Spartans finish at 15-4, there is a solid chance that the title will be lost by a half game. That said, there is also a negative impact of trying squeezing too many games into the back-half of the schedule. That impact cannot be quantified.
A few weeks ago, Coach Izzo did not appear to favor this trade-off, but the comments from the post-game press conference on Saturday seemed to suggest that the idea of rescheduling is gaining momentum. Only time will tell how that subplot will play out.
As for an update on the other notable statistics, I now have Michigan State's expected win total at 13.17. The odds of wining 14 or more games with the current schedule (without the rescheduled Michigan game) are 43 percent and the odds of winning 15 or more games are 19 percent.
The Spartans are still projected as the No. 3 or No. 4 seed in the Big Ten Tournament with just under a 70 percent chance to secure a top-four double bye. Michigan State's odds to win the Big Ten tournament ticked up a couple of percentage points to 13 percent.
Beware the Tom Izzo Bermuda Triangle
Prior to the win over the Wolverines this past weekend, the Spartans had lost two of the past three games in frustrating fashion. To fans, it feels like Michigan State does this almost every year. It is the very nature of college basketball that good teams sometimes take bad losses. It happens. But, it is the timing of the skid that feels so familiar.
A few years back, a poster on the Michigan State Rivals message board pointed out that this is a real effect. The member "CarlN" showed data that the over the last 20 years or so, Michigan State's winning percentage took a noticeable dip in late January and early February. Carl dubbed this time of year as the "Tom Izzo Bermuda Triangle."
I decided to also dig into this phenomena from a few different angles. I have a good database of MSU game result and spread data back to the 2006 season. I decided to study this effect using three factors: raw win percentage, performance against the spread, and performance relative to the Vegas spread expectation (which I will explain a bit later).
Let's start with the raw win percentage and the performance against the spread data in Figure 1.
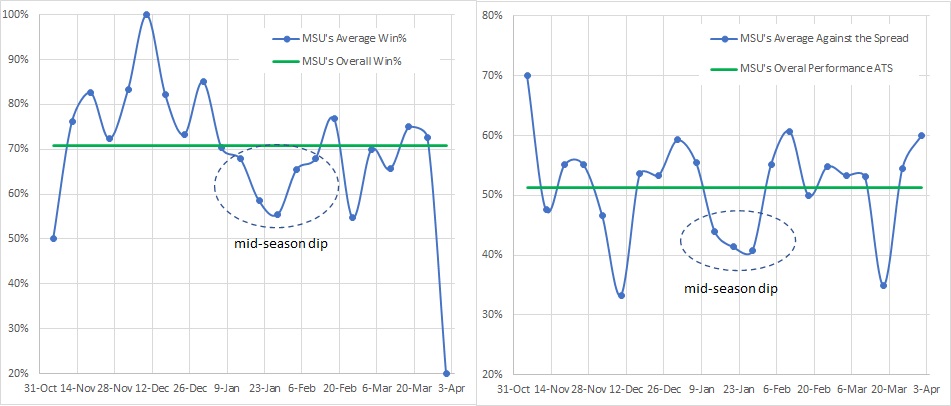 |
| Figure 1: Michigan State's raw win percentage (left panel) and performance against the final Vegas line (right panel) for the 2006-2021 seasons as a function of time (days from the beginning of season). |
In these two figures, I am calculating the seven-day average of the Spartans' performance for the 2006 to the 2021 season. Over this span, Michigan State has won slightly more than 70 percent of their games straight up and is just over 50 percent against the spread. These average values are shown as the horizontal line on each graph for reference.
While the data in both graphs fluctuates, there is only one part of each graph where there are several data points in a row that deviate noticeably from the average. The area of each graph is highlighted with the dashed oval and it spans a roughly three-week period from mid January to early February. During this time, on average, the Spartan's raw win percentage and performance against the spread dip by about 10 percentage points. This is the "Tom Izzo Bermuda Triangle."
But raw win percentage and covering the spread (or not) is perhaps not the best metric. The former does not account for the strength of the opponent and the latter does not account for winning or losing. Both metrics also also either "on or off", which makes quantification more challenging.
Therefore, I decided to run the numbers one more way that combines the best of both worlds. For each MSU game back to 2006, it is possible to calculate the odds that MSU should have won each of those games based on the final Vegas line. This "performance (a win or a loss) against this Vegas expectation" (or PAVE) is a scaled metric that accounts for winning and losing and the strength of the opponent. In my weekly odds update, this is essentially equivalent to the metric that I refer to as "luck."
In order to understand the PAVE metric, consider a situation where Michigan State is a 13-point favorite in a game. The odds of a Spartan win are 90 percent, based on historical data. If the Spartans win that game, it is just slightly better than expected. Mathematically, I would credit Michigan State with +0.1 of a win (or 1.0 minus 0.9) over expectation. However, if the Spartans were to lose that game, it would be a big hit. In this case the Spartans' would lose 0.9 of a win (or 0.0 minus 0.9).
In cases where the Spartans are a big underdog, the situation is reversed. In a game where Michigan State is a 13-point underdog, an upset win would earn the Green and White +0.9 of a win, but a loss would only subtract 0.1 of a win from the total. Games that are near toss-ups simply add or subtract roughly 0.5 of a win, depending on the exact spread.
Using this method, it is possible to track the Spartans trajectory, relative to expectation, throughout the course of each season. The best representation of the data that I could think of was to track the cumulative average PAVE metric as a function of the number of days from the beginning of the season. That data is shown below in Figure 2, and it is striking.
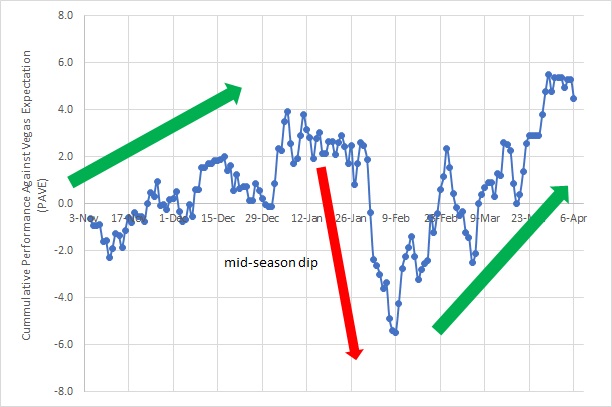 |
| Figure 2: Cumulative average PAVE for Michigan State for the 2006-2021 seasons as a function of days from the start of the season. |
The graph above appears to accurately trace the trajectory of an "average" Michigan State season. The first few games can be a bit rough, but then momentum (and wins) starts to build into the start of the new year. The metric holds steady in early January, but in late January or early February, there is a crash. Then, there is then a strong surge where the Spartans tend to overachieve for the rest of the season, right into March Madness.
Sounds familiar, right?
Granted, there are bumps along the road. There seems to be a dip right before Christmas and another dip right at the end of February, but the overall shape of the curve is very telling. There is also a lot of variance in the data from year to year. Some years don't follow this pattern at all, but more than half do. Figure 3 below shows the data for nine selected individual years back to 2007.
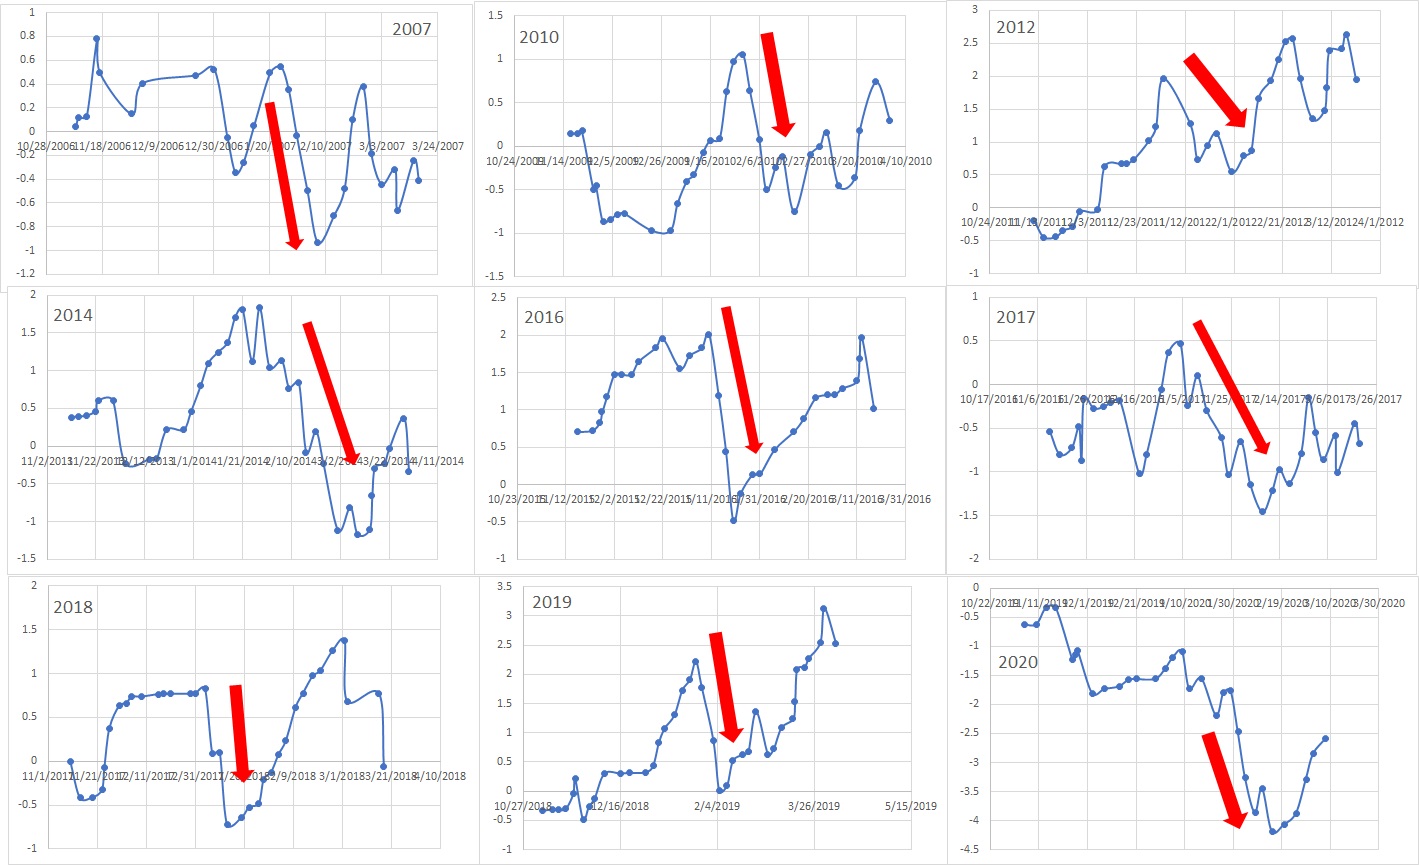 |
| Figure 3: Cumulative PAVE for a series of individual Michigan State seasons. |
In each case I have highlighted the apparent "mid-season dip." It tends to start and end at slightly different times and has lasted for less than a week or over a month. Taken together, however, it is possible to define, on average, when the "Tom Izzo Bermuda Triangle" occurs:
On average, it starts on Jan. 18 and lasts until Feb. 6 or about 19 days. Figure 2 also implies that it is most severe during the first week of February, or in other words: right now.
What's Next For MSU
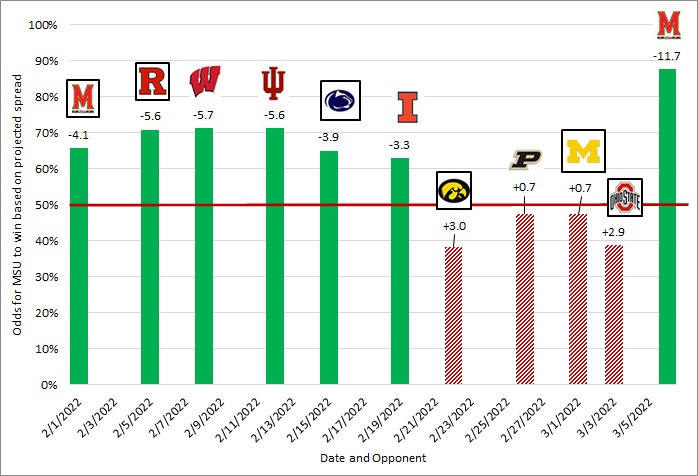 |
| Figure 3: Odds for MSU to win the remaining Big Ten games, based on Kenpom efficiency margins |
Comments
Post a Comment