Throughout the Big Ten basketball season. I have conducted an analysis on the results of a series simulations which provides various odds regarding the trajectory of the Michigan State men's basketball season and the Big Ten race as a whole.
In addition, I have provided additional analysis of Michigan State and the Big Ten race using Kenpom efficiency data compared to historical data and the set of statistics known as the "four factors of basketball success."
As the season goes on, the data changes almost daily. This post is meant to be a one-stop shop for the most updated data on the Big Ten race. In addition, this post will contain a explanation of how to read each table or figure. Analysis of the data will be done elsewhere. This post contains "just the facts."
Last Update: Jan. 22, 2024
Percentage of Big Ten games completed: 37.1%
Enhanced Big Ten Schedule
 |
| Table 1: Enhanced Big Ten standings as of Jan. 22, 2024 |
Table 1 below is what I refer to as the enhanced Big Ten standings. It includes the current Big Ten record of each team in addition to four other pieces of data.
First, it contains the current Kenpom rankings and adjusted efficiency margins (AdjEM) for each team. Second, it contains the "plus/minus" for each team. The value is equal to the number of road wins minus the number of homes losses.
Third, Table 1 lists the current "luck" for each Big Ten team. I define luck as the difference between the actual number of wins and the expected number of wins so far, based on the retroactive spreads derived from the Kenpom adjusted efficiencies of each team. Finally, the table contains the overall strength of schedule advantage/disadvantage relative to the conference average.
Big Ten Conference Win Matrix
 |
Table 2: Updated Big Ten expected wins and win distribution matrix as of Jan. 22, 2024.
|
Table 2 shows the odds that each Big Ten team will finish with any number of total conference wins, from zero to 20. This is based on a 1,000,000 cycle Monte Carlo simulation of the full Big Ten regular season where the current Kenpom efficiency margin for each team (also shown in Table 2) is used to project point spreads for all conference games.
The simulation also uniquely takes into account the historical uncertainty in each teams' efficiency margin based on the time remaining before Selection Sunday. The total number of expected wins are calculated based on the matrix. The values shown in parentheses are the change in each value since the last major update on Jan. 8.
Figure 1 below is a histogram showing the win probability distribution for Michigan State based on the data in Table 2.
 |
| Figure 1: Regular season Big Ten win probability distribution for Michigan State as of Jan. 22, 2024. |
Big Ten Regular Season Title Odds
 |
| Table 3: Odds to win or share the Big Ten regular season title and the win distributions for those winning teams as of Jan. 22, 2024. |
Table 3 above gives the odds for each team to win or share the regular season Big Ten title as well as the odds distribution for each team to win the title with a certain number of wins. For example, Purdue currently has a 71.5% chance to win the title. In 9.7% of the simulations, Purdue wins the title with an 18-2 record, but it is more likely (25.1% odds for each) that Purdue wins the title with a 17-3 or 16-4 record.
The bottom row in Table 3 gives the odds that the Big Ten champion(s) will finish the season with designated number of wins. The current most likely outcome (35.7%) is for at least one team to win the title with a 17-3 final record.
Figure 2 below is a pie chart showing the odds that the Big Ten title will be won be a single team or more than one team.
 |
| Figure 2: Odds for one or more teams to win the Big Ten regular season championship. |
Strength of Schedule
In order to calculate strength of schedule. I use the concept of expected value and run a sort of experiment where a hypothetical top-25-quality reference team plays every Big Ten schedule. The question that I ask is "how many games would this reference team be expected to win?" Mathematically this is equal to the sum of the odds for the reference team to win each game.
Figure 3 below shows the results of this calculation for the full Big Ten schedule.
 |
Figure 3: Big Ten overall strengths of schedule as of Jan. 22, 2024. The y-axis shows win percentage and the labels show the expected number of wins.
|
Figure 4 below gives the results of the same calculation where only the remaining conference games are considered.
 |
Figure 4: Updated Big Ten strengths of schedule for the remaining conference games as of Jan. 22, 2024.
|
Michigan State Schedule
Figure 5 below summarizes the projected point spread and win probabilities of all of Michigan State's remaining conference games.
 |
Figure 5: Odds for MSU to win the remaining Big Ten games, based on Kenpom efficiency margins.
|
Big Ten Tournament Odds
Table 4 below provides the odds that each team will earn each possible seed in the Big Ten Tournament based on the simulation of the remainder of the Big Ten regular season.
 |
| Table 4: Big Ten Tournament seeding odds as of Jan. 22, 2024. |
Table 5 below takes the data from Table 4 and gives the odds for each team to start the Big Ten Tournament on either Wednesday (no bye), Thursday (a single bye) or Friday (a double bye).
 |
Table 5: Odds for each Big Ten team to start the Big Ten Tournament with a double-bye, a single-bye, or no bye.
|
Table 6 below gives the odds for each team to advance in the Big Ten Tournament. As a general rule, these odds will track with Kenpom efficiency margins.
 |
Table 6: Odds for each Big Ten team to advance past each round of the Big Ten Tournament, as of Jan. 22, 2024.
|
Kenpom Efficiency Scatter Plot
 |
| Figure 6: Kenpom efficiency scatter plot as of Jan. 22, 2024. |
Figure 6 plots the defensive prowess of a given basketball team on the vertical y-axis against the offensive prowess on the horizontal x-axis. A team in the lower right-hand corner is good on offense, but weaker on defense. A team in the upper left-hand corner of the figure is good on defense, but weaker on offense. A team in the upper right-hand corner is good at both. Team who are good on both offense and defense are naturally contenders to win the National Championship. The shaded blue regions of the figure represent the efficiency profile of past National Champions prior to the start of the NCAA Tournament. Each National Champion back to 2002 is plotted in Figure 1 as a small, unlabeled blue diamond. Most of these diamonds fall with the darker blue shaded region. However, there are also a handful of outliers with slightly weaker profiles who fall in the lighter blue shaded area. No team has won the National Championship in the past 22 years or longer if they started the NCAA Tournament with an efficiency profile outside of the blue shaded area in Figure 1. This makes Figure 6 an excellent reference to quickly determine which teams are legitimate contenders in any given year. The labeled brown triangles in Figure 6 are the teams who currently have an efficiency profile consistent with a national contender. As for Michigan State, Figure 1 also documents the final efficiency profile of every Spartan team back to 1997 in the green circles. Each data point is labeled with the year and final NCAA Tournament result of each team. Finally, Figure 6 shows a series of dark green squares connected by a green line. This data set traces the trajectory of the 2023-24 Spartans' team efficiency profile from the beginning of the season until today. The green oval surrounding the current Michigan State data point represents the area in the figure where the Spartans are most likely to end the regular season, based on historical data. It is basically one standard deviation. |
The Four Factors
Briefly the four factors on both offense and defense are:
1. Effective field goal percentage (eFGPct)
2. Turnover percentage (TOPct)
3. Offensive rebounding percentage (ORPct)
4. Free-throw rate (FTRate)
Basically, the four factors account for how well a team shoots or defends shots (eFGPct), the ability of a team to create (or lose) shots opportunities (TOPct and ORPct), and the ability of a team to score or avoid points from the free throw line (FTRate).
The Table 7 below give the adjusted Kenpom offensive efficiency and performance in the four factors on offence for all 14 Big Ten teams. The teams are list in order of overall Kenpom efficiency margin, which is typically an accurate estimation of points spreads on a neutral court.
 |
Table 7: Comparison of Big Ten teams based on adjusted offensive efficiency and the four factors on offense.
|
|
Table 8 below provides the same analysis, but on the defensive side of the ball.
 |
Table 8: Comparison of Big Ten teams based on adjusted defensive efficiency and the Four Factors on defense.
|
Figure 7 compare the statistical profile of the 2023-24 Michigan State team to past Michigan State rosters in the form of a box plot.
 |
Figure 7: Box plot comparison of the current Michigan State team to all MSU teams since 1997 for the four factors on both offense and defense.
|
Game-by-game Four Factors Archive
Figure 8 provides an analysis for Michigan State's win at Maryland.
 |
Figure 8: Summary of the Four Factors in Michigan State's win at Maryland on Jan. 21.
|
Why did Michigan State win?
Shooting from the field cancelled out and the Spartans poor rebounding was offset by both taking care of the ball on offense and creating turnovers on defense. The difference in the game was the Michigan State was able to keep Maryland off the free throw line.
Figure 9 provides the analysis for Michigan State's home win over Minnesota.
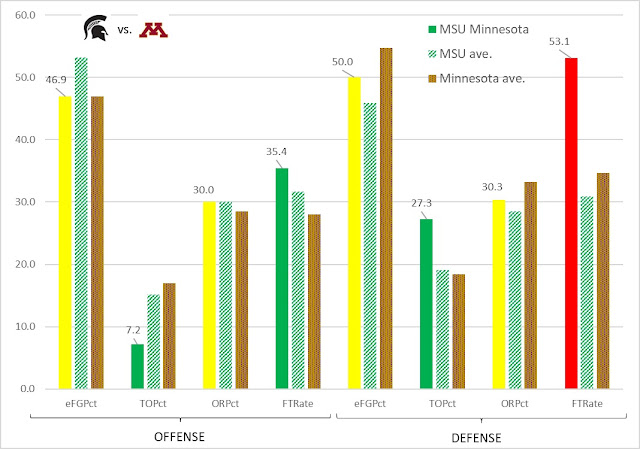 |
Figure 9: Summary of the Four Factors in Michigan State's win versus Minnesota on Jan. 18.
|
Why did Michigan State win?
Similar to the Maryland game shooting and rebounding were a draw. Against the Golden Gophers, Michigan State gave up way too many free throw, but the game was won due to a huge advantage in turnovers.
Figure 10 provides the analysis for Michigan State's home win over Rutgers on Jan. 14.
 |
Figure 10: Summary of the Four Factors in Michigan State's win versus Rutgers on Jan. 14.
|
Why did Michigan State win?
In this case, the Spartans enjoyed a huge advantage in shooting from the field. It also helped that Michigan State kept Rutgers off the offensive glass.
Figure 11 provides the analysis for Michigan State's loss at Illinois on Jan. 11.
 |
Figure 11: Summary of the Four Factors in Michigan State's loss at Northwestern on Jan. 11.
|
Why did Michigan State lose?
Shooting and turnovers were even in this contest and Michigan State won the battle of the boards decisively. This game was lost due to the huge advantage the home team had getting to the free throw line.
Figure 12 provides the analysis for Michigan State's loss at Northwestern on Jan. 7.
 |
Figure 12: Summary of the Four Factors in Michigan State's loss at Northwestern on Jan. 7.
|
Why did Michigan State lose?
Northwestern shot the ball crazy well and Michigan State lost the turnover battle badly. These factors easily overwhelmed the advantage that the Spartans had in rebounding and at the line.


Comments
Post a Comment