As we continue our mathematical journey down the recruiting rabbit hole, let's first review what we have learned. In Part One, I quantified the true value of star rankings and proposed a new recruiting metric, "NFL Draft Potential" or "NDP." In Part Two, we did a deep dive into the recent history of MSU recruiting and learned that MSU has consistently recruited at a "Tier 3 / Top 40" level which is good enough for fifth place in the conference behind Ohio State, Michigan, Penn State, and Nebraska.
As for the Pac-12 and Big 12, the trend is perhaps not as clear. The Big 12 seems to be bad across the board, with the exception of the low four-star recruits (5.8). As for the Pac-12, there are a few bright spots in the three-star bins (5.5 and 5.7) but everything else is negative.
In Part Three, we made a detailed and direct comparison of the on-the-field output of MSU and Michigan players over the past decade. Here we learned that while UofM has out-recruited MSU consistently, MSU's equally-ranked recruits have outperformed Michigan's recruits in almost all categories with respect to NFL, All Conference and Bust rates. That said, MSU's output has been on a down-tick since 2012, while Michigan has surged.
While the NFL Draft Potential is a projection or a measure of "input," once those recruits have completed their college careers, one can go back and actually count how many players in each class or team actually were drafted. Using this difference, we can quantify the over- or underachievement of any group of players, either by class, team, or conference. Let start with a simple example based on a full recruiting class.
In this Figure and in all subsequent similar figures, I had added a black "parity" line where the NFL Draft Potential is equal to the actual number of drafted players. This line defines the border between the overachievers (above the line) and underachievers (below it). Teams farther to the right have stronger recruiting and teams closer to the top put more players into the draft. The number in parenthesis after each team is the number of players drafted above/below expectation and is mathematically equivalent to the distance from the parity line.
A mentioned above, the top three teams in the conference as far as overachieving in recruiting are Ohio State, Iowa, and Penn State. What is interesting about Figure 4 is how each team got such high values. The team that fares the best with the highest rated players (with a rating of 5.9 and above) is actually Iowa. Although, in fairness, the Hawkeyes are strong across the board and only underachieve slightly in the low three-star bin (5.5). Also, the sample size for Iowa is small, as I count only four total recruits in the top bins total, three of which eventually were drafted.
The figure provides a more quantitative description of what we already learned in Part Three: MSU did a great job of putting players in the NFL up until the 2012 class and the trend is now moving in the wrong direction. Meanwhile, in Ann Arbor, the Wolverines slid from 2007 to 2011, but ever since 2012, they have trended up gradually. Based on the preliminary results from the 2016 class, Michigan may leap frog MSU in this metric by next year. Time will only tell how the 2017 class and beyond will pan out.
In the SEC, it is not surprising that the usual suspects of Alabama (+18.66), Florida (+15.01), LSU (+10.44), and Georgia (+6.71) lead the pack both in raw recruiting and in the over-achievement of putting players into the NFL draft. Alabama ranks second behind Ohio State nationally in over-achievement and Florida is third.

As Figure 11 shows, the Pac-12 as a whole is a bit of a mixed bag. Only four schools are solidly in the overachiever category, led by Stanford (+12.07), Washington (+5.67), Oregon (+4.00), and as a mild surprise, UCLA (+2.43). The Cardinal's score is good enough for fifth place nationally.
In a word, this is bad. As Figure 12 shows, only two Big 12 teams are above average relative to draft expectation: West Virginia (+4.44) and Oklahoma (+2.94). TCU (-0.62) and Baylor (-0.87) are basically average and the remaining teams are just plain bad. The obvious standout is Texas (-15.76) who obviously recruits well (seventh place overall in this nine-year period) but the Longhorns' number of draft picks relative to expectation is dead last in the Power Five. Also note that the team with the overall best performance relative to expectation is West Virginia, who is geographically isolated from the rest of the conference.
As a group, the Big Ten and the ACC are doing the best at sending recruits to the NFL draft, with the SEC in third place and still in positive territory. Meanwhile, the Pac-12 and the Big 12 both lag behind in this metric. The difference between the Big Ten and the Big 12 is over 80 players drafted in a nine year span.
While comparing MSU to Michigan is certainly of interest to MSU fans, it is also interesting to look at how MSU's recruiting and output compares to the entire Power Five. A detailed comparison of each Power Five team's All Conference or Bust rate requires far more data than even I have. But, if we return to the NFL Draft Potential metric, it can provide a 40,000 mile view of how each team's recruits have done based simply on NFL draft rates relative to their Power Five peers.
The method that I will use is straightforward. As I introduced in Part One, there is a clear correlation between the Rivals rating bin and the rate at which players in those bins will eventually get drafted into the NFL. This correlation can be used to calculate an expected value or probability that any given incoming recruit will eventually get drafted, and those individual probabilities can be used to quantity the strength of each team's recruiting class. For reference, I will once again show this correlation from Part One.
 |
| Figure 1: NFL draft rate as a function of high school recruiting rating |
While the NFL Draft Potential is a projection or a measure of "input," once those recruits have completed their college careers, one can go back and actually count how many players in each class or team actually were drafted. Using this difference, we can quantify the over- or underachievement of any group of players, either by class, team, or conference. Let start with a simple example based on a full recruiting class.
For the 2015 high school recruiting class, the bulk of which completed their eligibility over the last two seasons, it is easy to sum over the individual NFL Draft Potential score of all player who signed with a Power Five school. That number turns out to be: 177.7. So, out of the almost 4,000 "recruit-able" athletes in the 2015 class, we would expect roughly 178 to eventually be drafted from the group of Power Five schools. If we go through and count the number of players from that class that were actually drafted, the count is 184 players. So, the 2015 class, as a whole "overachieved" by a little over six players, relative to the nine total classes in this analysis (2007 to 2015). A summary of those nine classes is shown below:
 |
| Figure 2: Relative output of each high school recruiting class based on NFL Draft rate |
As we can see, four of the past five classes over-achieved based on this metric by roughly five or six players, while the 2007, 2008, and especially the 2012 classes underachieved. The 2009 and 2010 classes were basically average. That said, a deviation of five or six players out of almost 200 is only a few percent and is likely not that significant. Things get much more interesting if we look at the performance of teams and conferences specifically.
Big Ten Overview
After squinting at the data for a while, I found that it is the most informative to look at an entire conference based on both their total NFL Draft Potentials and actual NFL Draft picks for the time frame of interest. Let's start this analysis close to home with the 14 teams of the Big Ten.
 |
| Figure 3: Comparison of the actual number of NFL Draft picks for all Big Ten schools relative to the combined NFL Draft Potential for the 2007-2015 classes |
In this Figure and in all subsequent similar figures, I had added a black "parity" line where the NFL Draft Potential is equal to the actual number of drafted players. This line defines the border between the overachievers (above the line) and underachievers (below it). Teams farther to the right have stronger recruiting and teams closer to the top put more players into the draft. The number in parenthesis after each team is the number of players drafted above/below expectation and is mathematically equivalent to the distance from the parity line.
The first thing to notice about the data is that Ohio State is scary good. Not only did they out-recruit the rest of the conference by a substantial amount from 2007 to 2015, they also put a ton a players into the NFL Draft. Their number of drafted players relative to expectation is a staggering +20.54, which is easily the best in the nation over that time frame. Based on this it is a bit of a surprise that the Buckeye have not been even more successful than they have been over the past decade.
The graph also shows that four other Big Ten schools who are clearly overachieving in regards to sending players to the draft. Two of them are Penn State (+10.42) and Iowa (+10.69). While Penn State clearly brings in more highly ranked recruits, both schools are overachieving at essentially the same level. The other two team in this category are MSU (+5.18) and Wisconsin (+4.78) who also over-achiever at similar levels. MSU recruits better on paper than both Iowa and Wisconsin, yet the Hawkeyes have sent more players to the NFL Draft over this period of time. It is a bit surprising that Iowa has not had more success in the Big Ten West.
Six additional Big Ten teams fall very close to the parity line, including Illinois (+2.04), Michigan (+1.38), Purdue (-1.02), Rutgers (-1.14), Nebraska (-2.65), and Northwestern (-2.81). Two teams generally fare a little worse than that: Indiana (-3.67) and Maryland (-3.71). Finally, there is one unexpected team at the very bottom of this analysis: Minnesota (-8.23). The Gophers, on paper, recruit just as well as Iowa and Wisconsin, but Minnesota has sent only nine players into the draft from 2007 to 2015 compared to 28 for Iowa and 22 for Wisconsin (not counting walk-ons). That is simply incredible.
A Closer Look at The Big Ten
Figure 3 gives a big picture snapshot of the Big Ten as a whole, but it is also informative to look at how each team performs relative to the level of recruit that they bring in. Figures 4 through 7 give a breakdown of the number of players drafted relative to the expected value as a function of the original high school recruiting ratings. Let start at the top of the conference (as ranked by the differential).
 |
| Figure 4: Acutal draft picks relative to expectation broken down by recruiting rating bins for the top of the Big Ten |
A mentioned above, the top three teams in the conference as far as overachieving in recruiting are Ohio State, Iowa, and Penn State. What is interesting about Figure 4 is how each team got such high values. The team that fares the best with the highest rated players (with a rating of 5.9 and above) is actually Iowa. Although, in fairness, the Hawkeyes are strong across the board and only underachieve slightly in the low three-star bin (5.5). Also, the sample size for Iowa is small, as I count only four total recruits in the top bins total, three of which eventually were drafted.
Penn State is also strong across the board, but they are particularly good at putting three-star recruits into the Draft. As for the Buckeyes, they underachieve a bit with the truly elite players, but they are outstanding with low four-star (5.8) and high three-star (5.7) recruits. They overachieved by almost 16 drafted players in these two bins. That is flat out ridiculous.
Figure 5 compares the relative performance of the remaining Big Ten team who on balance are above average: Michigan State, Wisconsin, Illinois, and Michigan.
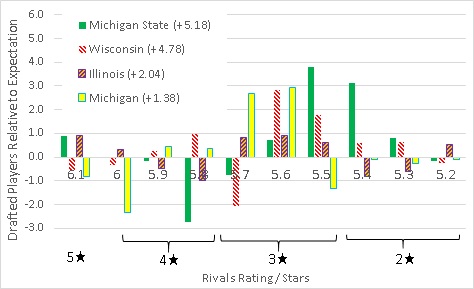 |
| Figure 5: Acutal draft picks relative to expectation broken down by recruiting rating bins for the middle/top of the Big Ten |
Based on this analysis, we can see that MSU does well with five-star players and does really well with low three-star and high two-star players. MSU has overachieved by almost seven total players in the 5.5 and 5.6 bins combined, which is the best of all Power Five teams in this time frame. On the negative side, MSU has struggled to put low four star (5.8) recruits into the Draft.
Wisconsin's performance is bit more erratic. The Badgers are fairly strong across the board, and have done particularly well with 5.6- and 5.5-rated player. However, they have struggled with high three-star (5.7) recruits and to some extend with the limited number of five-star players who have signed with them.
Illinois is simply average over almost all categories and on balance lands in slightly positive territory overall. As for Michigan, they notably struggle a lot with the Top 75 level recruits (6.1 and 6.0), but in this analysis, they have done well with the high three-star recruits (5.7 and 5.6).
At this point, I should explain that the data shown above in Figure 5 does tell a slightly different story from of Part 3 of the series. In that more detailed analysis, MSU held an advantage over Michigan in basically every bin except the low four-star (5.8) one. Here, Michigan looks stronger in the 5.6 and 5.7 bins.
The reason for this difference is two-fold. First, the data used to generate Figure 5 considers ONLY players who were actually drafted, and not players who had a stint in the NFL as undrafted free agents (or were either busts or All-Conference honorees). MSU has had more undrafted free agents in the 5.6 and 5.7 bins (a total of 11) than has Michigan (a total of only three), which accounts for much of this difference.
The second factor has to do with the issue of transfers. For this analysis, I decided to count players who get drafted for the teams that originally signed them out of high school. In this case, Michigan's score is boosted by a pair of 5.7 rated players who signed with them, but transferred and were later drafted elsewhere. MSU is similarly boosted by Nick Foles (5.5) and Montez Sweat (5.3). All of those players were considered as Busts in the analysis I did in Part Three.
The issue of how to deal with transfers in this analysis is tricky, in general, but the advantage of my method is that it once again can be easily applied to all teams without the need to make a judgment call as to which school is responsible for the success of a given player who played in multiple places. In effect, I am biasing this analysis to focus slightly more on the evaluation of high school talent rather than its development. My belief is that the effect of transfers is small and will largely cancel out over a large data set.
Moving on to the teams towards the bottom of the Big Ten, Figure 6 summarizes the data for Purdue, Rutgers, and Nebraska. Purdue is roughly the mirror image of Illinois: they are basically average in all categories, but on balance are net negative in sending recruits to the NFL Draft, relative to expectation. Rutgers seems to struggle with all highly ranked players expect high four-stars (5.8) and especially struggles with high three star recruits (5.7), but they have some success with low three-stars (5.5). Nebraska is more erratic. They have done well with high three star recruits (5.7), but terrible with low four-star recruits (5.8).
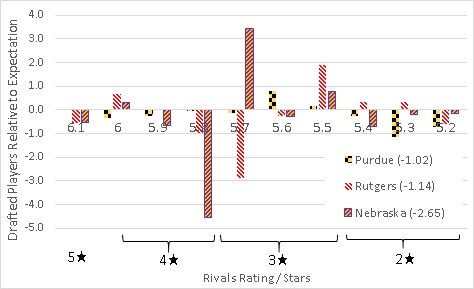 |
| Figure 6: Acutal draft picks relative to expectation broken down by recruiting rating bins for the middle/bottom of the Big Ten |
Last and literally least are the remaining four Big Ten teams: Northwestern, Indiana, Maryland, and Minnesota. As Figure 7 shows, these four teams generally seems to underachieve everywhere, with a few exceptions. Northwestern and Maryland do OK with mid-four star (5.9) recruits, and Maryland has a bright spot in the low three-star (5.5) bin. All four schools, as a general rule, do poorly with three-star and low four-star recruits (5.5 to 5.8). Then, there is Minnesota, who somehow underachieves in every bin down to the mid to low two-star range (5.2 and 5.3).
 |
| Figure 7: Acutal draft picks relative to expectation broken down by recruiting rating bins for the bottom of the Big Ten |
As a final note on this data, as we saw in Part Three of this series, each class and each team is different, and the performances can vary drastically from year to year. The data shown above is a snapshot from a very specific range of time in history. Just to get a feel for how the number of drafted players relative to expectation can change over time, Figure 8 shows a waterfall plot comparison of MSU and Michigan from the 2007 to 2015 recruiting classes, using the same scale.
 |
| Figure 8: Waterfall chart comparison of the changes in actual drafts picks relative to expectation for MSU and Michigan for the 2007 to 2015 recruiting classes. |
The figure provides a more quantitative description of what we already learned in Part Three: MSU did a great job of putting players in the NFL up until the 2012 class and the trend is now moving in the wrong direction. Meanwhile, in Ann Arbor, the Wolverines slid from 2007 to 2011, but ever since 2012, they have trended up gradually. Based on the preliminary results from the 2016 class, Michigan may leap frog MSU in this metric by next year. Time will only tell how the 2017 class and beyond will pan out.
The Rest of the Power Five
While MSU fans are mostly concerned with our own conference, it is interesting to also take a look at the other four Power Five conferences as well in order to see how they are performing. Let's start with the SEC.
 |
| Figure 9: Comparison of the actual number of NFL Draft picks for all SEC schools relative to the combined NFL Draft Potential for the 2007-2015 classes |
In the SEC, it is not surprising that the usual suspects of Alabama (+18.66), Florida (+15.01), LSU (+10.44), and Georgia (+6.71) lead the pack both in raw recruiting and in the over-achievement of putting players into the NFL draft. Alabama ranks second behind Ohio State nationally in over-achievement and Florida is third.
It is a bit surprising to see the Gators so high considering that they have only played in two SEC Championship games since 2010. That is the same number of title game appearances as Missouri (+2.39) who also has over-achieved in this time frame along with another surprise entry: Arkansas (+5.00).
What is perhaps more surprising in the number of SEC teams that are clearly in the underachiever category. Three teams (South Carolina [-4.10], Kentucky [-6.91], and Auburn [-7.92]) total would be in second-to-last place in the Big Ten and two additional teams (Ole Miss [-11.10] and Tennessee [-14.88]) would be dead last.
The struggles of those bottom three teams in the SEC are particularly noteworthy as Auburn, Ole Miss, and Tennessee rank 53rd, 63rd, and 64th out of the 65 Power Five teams for under-achievement. Yet, both Auburn (No. 9) and Tennessee (No 10) rank in the Top 10 in total NFL Draft Potential in this time frame, while Ole Miss is in the Top 20 (No. 19).
Next, let's take a look at the ACC (plus Notre Dame)
 |
| Figure 10: Comparison of the actual number of NFL Draft picks for all ACC schools relative to the combined NFL Draft Potential for the 2007-2015 classes |
On balance, the picture for the ACC looks pretty positive. Not surprisingly, Clemson (+13.33, good for 4th nationally) leads the way in draft picks relative to expectation. However, it is perhaps a surprise that the Tigers are only fourth overall in the ACC in NFL Draft Potential for the 2007 to 2015 classes. It should be noted that the teams that out-recruited Clemson in this period (Florida State [+6.85], Notre Dame [+6.66], and Miami [+9.78]) also do a good job at putting players into the draft.
Other ACC teams that over-achieve include North Carolina (+4.04), NC State (+8.38), Louisville (+3.16), and Boston College (+3.53). Only six total ACC teams under-achieve relative to expectation, the most notable of which are Virginia Tech (-4.75) and Virginia (-6.85).
Next up is the Pac-12.
| Figure 11: Comparison of the actual number of NFL Draft picks for all Pac-12 schools relative to the combined NFL Draft Potential for the 2007-2015 classes |
As Figure 11 shows, the Pac-12 as a whole is a bit of a mixed bag. Only four schools are solidly in the overachiever category, led by Stanford (+12.07), Washington (+5.67), Oregon (+4.00), and as a mild surprise, UCLA (+2.43). The Cardinal's score is good enough for fifth place nationally.
On the other side of the coin are the five schools that significantly underachieve. From the point of view of performance relative to expectation, Colorado (-7.23), Arizona State (-8.24), Washington State (-8.77), and Arizona (-10.10) are the worst.
But, USC's poor relative score of -5.92 is notable because the Trojans obviously have recruited the best in the conference by a significant margin. Their total NFL Draft Potential over this nine-year period is second only to Alabama. They still lead the conference overall in total draft picks, but they should be doing even better.
Finally, here in the chart for the Big 12.
 |
| Figure 12: Comparison of the actual number of NFL Draft picks for all Big 12 schools relative to the combined NFL Draft Potential for the 2007-2015 classes |
In a word, this is bad. As Figure 12 shows, only two Big 12 teams are above average relative to draft expectation: West Virginia (+4.44) and Oklahoma (+2.94). TCU (-0.62) and Baylor (-0.87) are basically average and the remaining teams are just plain bad. The obvious standout is Texas (-15.76) who obviously recruits well (seventh place overall in this nine-year period) but the Longhorns' number of draft picks relative to expectation is dead last in the Power Five. Also note that the team with the overall best performance relative to expectation is West Virginia, who is geographically isolated from the rest of the conference.
Overall Conference Comparison
One thing that should be very clear from Figures 3 and 9 though 12 is that there is a major difference in the NFL draft performance relative to expectation between the different Power Five conferences. In Figure 13, this difference can be seen more directly by considering each conference as a whole:
 |
| Figure 13: Comparison of the actual number of NFL Draft picks relative to the combined NFL Draft Potential for all members of each Power Five conference combined for the 2007-2015 classes |
As a group, the Big Ten and the ACC are doing the best at sending recruits to the NFL draft, with the SEC in third place and still in positive territory. Meanwhile, the Pac-12 and the Big 12 both lag behind in this metric. The difference between the Big Ten and the Big 12 is over 80 players drafted in a nine year span.
The final set of data to review for today is a breakdown of each conference by recruiting bin to see in more detail where the advantages and disadvantages really are. Let's start with the three conferences who are above water.
 |
| Figure 14: Acutal draft picks relative to expectation broken down by recruiting rating bins for the top three Power Five Conference as a whole. |
While all three conferences are strong, their strength lies in slightly different places. Both the ACC and the SEC overachieve with the elite-level five- and four-star recruits. The SEC does particularly well with the Top 75 (6.1 and 6.0 rated recruits) and the ACC does well with mid four-stars (5.9). It should noted that for the five-star recruits, Alabama and Clemson alone really dominate this category, with a relative draft score of +10.80 (which means the rest of the country combined is -10.80.) In contrast, the Big Ten distinguishes itself by excelling at placing three-star and even two-star players in the NFL draft (5.4 to 5.7.)
 |
| Figure 15: Acutal draft picks relative to expectation broken down by recruiting rating bins for the bottom two Power Five Conference as a whole. |
As for the Pac-12 and Big 12, the trend is perhaps not as clear. The Big 12 seems to be bad across the board, with the exception of the low four-star recruits (5.8). As for the Pac-12, there are a few bright spots in the three-star bins (5.5 and 5.7) but everything else is negative.
Earlier in this series, it was stated that recruiting rankings are not everything. Today, we learned that certain teams really do overachieve while others underachieve as measured eventually by the NFL Draft. It is also notable here that the teams that both recruit well and overachieve (like Ohio State, Alabama, Clemson, LSU, Georgia, etc.) are also the teams that seem to win a lot of games and make appearances in New Years Six Bowl games and the College Football Playoff.
In contrast, some teams recruit well, yet underachieve in NFL draftees (like Texas, USC, and Tennessee). It is no surprise that these are the teams that seem to underachieve on the field as well. This is a topic that I will explore in more detail in a later entry in this series.
For now, however, there is another observation from today's data set worth noting, and that is the impact of geography. Based on today's analysis, recruits that play for teams in the Midwest (i.e. Big Ten) seems to fare better, relatively speaking, than recruits from Southern and Eastern teams (i.e. the SEC and ACC), and a lot better than recruits who play for teams out West (Pac-12) or in the middle of the country (Big 12).
Is this trend due to the Universities themselves or something else? Do some states or regions tend to produce recruits who are more likely to be overrated or underrated? If this is true, does this provide a clue about regions that Universities should target more aggressively on the recruiting trail? I will explore these questions in more detail in the next installment of this series.
Until next time, stay home, stay safe, wash your hands, and Go Green.
Comments
Post a Comment