Everybody probably has their favorite position. Some prefer the strong leadership qualities of the quarterback. Others may prefer the big uglies, like linemen. Some like a super athletic type, such as a running back or linebacker. Still others would choose someone with a bit more skill, such as a wide receiver or defensive back. Here is Big Ten country, pretty much everybody likes a nice tight end.
Throughout this month-long exploration of the college football recruiting landscape, we have explored quite a few topics. In Part One, we learned how to properly count star ratings. In Part Two, we reviewed the past decade of MSU recruiting classes. Parts Three and Four examined the output of MSU players compared to UofM and the rest of the country. In Part Five, we specifically looked at the role of geography and found that some areas of the country seem to produce high school football talent at a more efficient rate (as measured by the NFL draft) than others.
Up until now, all recruits in the same ratings / star bin were treated equally, whether they were a quarterback or a kicker. But, not all football players are created equally, so it seems reasonable to see if some positions have better luck in the NFL draft or if some state or universities are better at producing and/or developing certain position groups.
By now, the methodology should be familiar. By using the NFL Draft Potential metric that I introduced in Part One, it is possible to count up the potential number of draft picks that a group of quarterbacks, linemen, or running backs should produce and then compare that potential number to the actual number of players that were eventually drafted. In a way, this is a measure of the recruiting efficiency of a given position group.
Once again, my baseline time frame includes the high school classes between 2007 and 2015. For this purpose, I am using whatever position was listed for each player in the Rivals Database that I used as my source material, with no attempt to correct it if that player played a different role in college. Let's begin by analyzing each position group en mass.
Overall over/underrated positions
The absolute simplest calculation that I can make is to simply compare actual number of NFL draft picks to the sum total NFL Draft Potential for the entire batch of a certain playing group over the full nine-year time frame. For example, from 2007 to 2015, a total of 675 players listed in the Rivals database as quarterbacks committed to a Power Five school. Those 675 players had a combined NFL Draft Potential of 88.26. However, only 82 of those players actually would up being drafted, which means that the quarterback position underachieved by a little over six players.
Now, it is reasonable to ask the question as to whether this difference is large enough to be statistically significant. If I think of this specific question, it is akin to a coin flip experiment where the coin in this case is weighed to reflect the expected odds of a quarterback being drafted, which based on the information above is (88.26 / 675 =) 25.8 percent. If it possible to then see where the number 82 lies on the binomial distribution made up of 675 trials with a "successful" probability of 25.8 percent. In this case, the answer is at about the 26th percentile, which is not considered significant.
What about the other playing groups? The figure below shows the number of NFL draft picks relative to expectation for each of the eleven different high school positions listed in the recruiting database. Above each bar I show the calculated position on the appropriate binomial distribution which is an estimate of the level of statistical significance. I colored in red the positions where the deviation appears significant to a 5/95 percent confidence level.
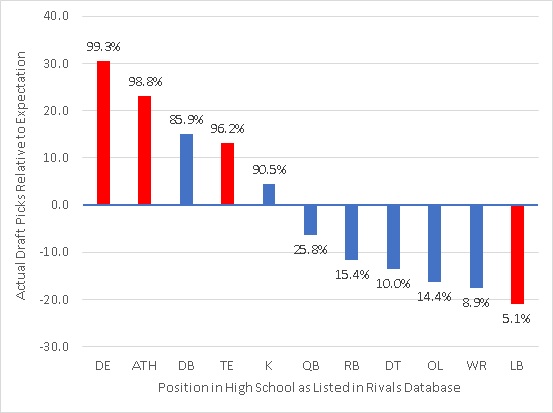 |
| Figure 1: Actual number of NFL Draft picks relative to expectation for the eleven main position groups for the 2007 - 2015 recruiting classes. |
As we can see, it seems that players listed as defensive ends, athletes, or tight ends are more likely to get drafted than their similarly ranked peers who were defensive tackles, wide receivers, or especially linebackers. Four of those categories are clearly statistically significant. But, the mere fact that ten of the eleven categories (all except quarterbacks) are significant to at at least a 15/85 percent level suggest to me that this effect, in general, is a real one.
Now that we know some position groups tend to get drafted at a higher rate than others, it is possible to re-normalize the expected value calculations to reflect this difference. Going forward in this analysis all future calculations in this part will take the bias shown in Figure 1 into account.
National Position Overview
In the previous entries in this series, I went into great detail about the overall over- and underrated recruiting ability of the entire Power Five. But, it is certainly possible that some schools might be bad at recruiting overall, but surprising strong with a few isolated playing groups. This data set allows us to explore this possibility.
I went through and made the draft picks relative to expectation calculation for all Power Five teams and all eleven position groups. Let's begin in the Big Ten, and let's start by simply looking at the success (or lack there of) with offensive players and defensive players separately. If we plot those groups on separate axes, we can visualize the entire Big Ten as shown in Figure 2.
 |
| Figure 2: Breakdown of the recruiting efficiency of offensive and defensive players for the Big Ten |
Note that for this analysis, players listed as "athletes" are excluded, as it is unclear from the raw data which position those players actually played in college. I have no interest in manually looking that up for the 1,000+ players in the database.
Just from this simple division of the data, some interesting trends start to appear. For example, Ohio State is essentially equally as dominant in sending offensive and defensive players to the draft. Penn State is a little better with defensive players and Iowa is a little better with offensive players. As for Michigan State, it seems a bit hard to believe, but MSU is essentially average for defensive players relative to expectation. The bump for MSU comes on the offensive side of the ball (and +2.196 for athletes, not shown here).
Other than just having a red and white color scheme, Indiana and Wisconsin both overachieve when it comes to sending offensive players to the draft, but they underachieve with defensive players. The opposite is true for Purdue and Nebraska. Then, there are teams like Maryland, Northwestern, and Minnesota that struggle on both sides of the ball.
As for the rest of the Power Five, Figure 3 give the breakdown for the ACC and SEC.
 |
| Figure 3: Breakdown of the recruiting efficiency of offensive and defensive players for the ACC and SEC |
Interestingly, the ACC mostly is strong on defensive, except for the schools that struggle overall. Clemson and Florida State are basically average on offense, but very strong on defense. Miami leads the conference in putting offensive players into the draft, and is second in the Power Five only to Ohio State. Virginia Tech is notably below average in placing defensive players into the draft relative to expectation, but average on offense.
As for the SEC, most teams are pretty balanced. They are just really good on both sides of the ball (like Alabama), average (like Texas A&M) or bad (like Ole Miss). Florida has had a lot of success with defensive players, while Vanderbilt actual has overachieved on the offensive side of the ball almost as much as Alabama. They have just struggled mightily with defensive players.
Figure 4 gives the breakdown for the Pac-12 and Big 12.
 |
| Figure 4: Breakdown of the recruiting efficiency of offensive and defensive players for the Pac-12 and Big 12 |
In the Pac-12, Stanford is clearly at the head of the class on both sides of the ball. Oregon's strength is on the offensive side of the ball, while Washington's over-achievement is entirely on defense.
In the Big 12, only West Virginia is in positive territory on both sides of the ball. Oklahoma is strong on offense, but average on defense. Most of the rest conference is very below average on defense, with the exception of TCU, and only other above average team with offensive players is Baylor. Interestingly Texas is just a little below average with defensive players. It's putting offensive players into the draft where they are downright awful.
It is also possible to give a more in-depth look at exactly how each team stacks up for the individual position groups, relative to national averages. To simplify things a bit, let's look at the total performance for each conference, starting with the Big Ten, ACC and SEC in Figure 5.
 |
| Figure 5: Summary of the number of NFL Draft picks relative to expectation broken down by position group for the Big Ten, ACC, and SEC conference as a whole based on overall recruiting efficiency. |
As we can see, the major conferences overall definitely have their preferred positions. Overall, the Big Ten does especially well with athletes, defensive tackles, quarterbacks, and wide receivers. The lone weak position group relative to expectation is the offensive line, which I find to be rather surprising for the conference that is supposed to be filled with slow, lumbering, run-first offensives.
In the ACC, most position groups are very average, but ACC teams as a group have done very well with defensive linemen and the secondary. As for the SEC, there are clear strengths and weaknesses. The strong positions are running back, linebackers, and offensive linemen. However, high school defensive backs, tight ends, and athletes who commit to SEC teams are below average overall in getting to the NFL draft.
As for the Pac-12 and Big 12, following the analysis in Parts Four and Five, it seems reasonable to ask if those two conferences are actually good at anything. Figure 6 may provide this answer.
 |
| Figure 6: Summary of the number of NFL Draft picks relative to expectation broken down by position group for the Pac-12 and Big 12 conference as a whole based on overall recruiting efficiency. |
For the Pac-12 as a whole, there are some glimmers of hope. The conference overall is above average with defensive backs, tight ends, and to a lessor extent, running backs and offensive linemen. Defensive linemen and quarterbacks are the weakest positions. As for the Big 12, it is a mess across the board, especially with running backs and basically all positions on the defensive side of the ball.
A Closer Look at the Big Ten
I could spend a lot more words looking at each Big Ten team's performance by position group in detail, but let's just focus on the six conference teams that have had the most luck in sending players to the draft at high rates of efficiency. As we learned in Part Four, the three best teams in the conference when it comes to putting player into the draft (relative to expectation) are Ohio State, Penn State, and Iowa. Let's start with just those three teams, as shown in Figure 7.
 |
| Figure 7: Summary of the number of NFL Draft picks relative to expectation broken down by position group for the top three Big Ten teams based on overall recruiting efficiency. The number above each bar in the national rank for the team in that position group |
In this case, the number above each bar is the national rank among all 65 Power Five schools for that position group. Already we can see that teams clearly have strengths and weaknesses in the identification and development of players in certain playing groups. Ohio State is strong everywhere, and in fact is top five in three categories (wide receiver, defensive tackle, tight end, and line backer) and in the top ten in one other (defensive backs).
Penn State is in the top five with three position groups (wide receivers, defensive ends, and defensive backs), but the Nittany Lions are below average with offensive lineman. As for Iowa, they rank in the top eleven for five position groups including offensive linemen, defensive ends, defensive backs, defensive tackles, and interestingly, quarterback. Relative to expectation, the Hawkeyes are No. 1 in the entire Power Five in placing high school quarterbacks into the NFL Draft, relative to expectation. Meanwhile, Iowa is notably below average with running backs and wide receivers, which helps to explain why their offense seems to struggle despite a history of good lineman and quarterbacks.
A look at Iowa's success at the quarterback position does require a bit more investigation. As I check the details, I count four total high school quarterbacks who signed with Iowa and were later drafted between 2007 and 2015: Marvin McNutt (5.7 rating), Micah Hyde (5.4), Jake Rudock (5.6), and C.J. Beathard (5.6). The tricking thing is that McNutt played wide receiver in college, Hyde played defensive back, and Rudock was a grad transfer to Michigan.
So, Iowa seems to benefit a bit from some of the specific assumptions that I have made in this analysis. I choose to take the position listed in the Rivals database at face value, and I decided to credit the original University that signed a player, even if they wound up transferring. In the case of Rudock, he did play most of his snaps at Iowa, so I think that is reasonable. Either way, Iowa is clearly good at recognizing NFL talent in the high school ranks, and if were to attempt to try to "correct" for these differences in position from high school to college, it would either be prohibitively time consuming or would inject unwanted bias into the analysis.
As for the other set of three Big Ten teams that warrant closer examination, it makes sense to look at Wisconsin, Michigan, and of course, Michigan State. These data are shown in Figure 6.
 |
| Figure 8: Summary of the number of NFL Draft picks relative to expectation broken down by position group for the top three Big Ten teams based on overall recruiting efficiency. The number above each bar in the national rank for the team in that position group |
With this set of teams, it is clear that there are even more highs and lows. The Badgers are in the top 10 with running backs, offensive lineman (no shockers there), linebackers, and athletes. However, they are quite below average with quarterbacks, defensive ends, and defensive backs.
As for the Wolverines, they only make as appearance in the Top 10 in one category: defensive tackle. That said, they are above average with wide receivers, athletes, and linebackers. Meanwhile the high school running backs, defensive ends, and defensive backs who wind up in Ann Arbor should not plan to do as well as their similarly ranked friends who pick another school.
As for Michigan State, the positional ranking provide some interesting insights. First, MSU ranks in the top 11 of the Power Five with four total position groups: quarterbacks (No. 5), defensive backs (No. 7; no surprise here), athletes (No. 7), and tight ends (No. 11). MSU is also above average in sending high school wide receivers to the draft.
As for running backs, defensive ends, and defensive tackles, MSU is essentially average. The areas where MSU really struggles are offensive lineman (No. 54, not a surprise) and linebackers (No. 53, and to me a much bigger surprise).
If we dig a bit deeper into MSU's numbers, the data above seems pretty reasonable. Starting at the quarterback position and based on this analysis, MSU has overachieved by putting almost two "full" quarterbacks more than expected into the NFL Draft. Those quarterbacks include Kirk Cousins (class of 2007, 5.5 rating), Conner Cook (2011, 5.7) and Nick Foles (2007, 5.5.)
Of course, Foles spent most of his college days in Arizona, but MSU did first identify and sign him, so that does count for something. MSU is still solidly above average without him. Ironically, of the seven total quarterbacks signed over this nine-year span, the three drafted ones were the three lowest ranked coming out of high school. We had much higher hopes for the likes of Tyler O'Connor (2012, 5.7), Joe Boisture (2010, 5.8), Brian Lewerke (2015, 5.8), and Andrew Maxwell (2009, 5.8).
MSU's high rank in the defensive back category also makes perfect sense. MSU signed 23 total DBs in this time frame, and five of them got drafted: Darqueze Dennard (2010, 5.4), Trae Waynes (2011, 5.4), Montae Nicholson (2014, 5.9), Chris L. Rucker (2007, 5.5), and Trenton Robinson (2008, 5.4). It should be noted that three of those NFL draft picks started out as lowly 2-star recruits.
The "athlete" category in high school is clearly the toughest to actually define, but MSU has done well here also. For the record, four of MSU's 13 signed athletes have been drafted in this time frame: Jeremy Langford (2010, 5.6), Khari Willis (2015, 5.6), Tony Lippett (2010, 5.5), and Keith Mumphrey (2010, 5.7). Those players wound up playing running back, wide safety, and wide receiver (mostly). As for notable highly ranked athletes that went undrafted, those include All-Conference linebacker Andrew Dowell (2015, 5.8) and contributor T.J. Harrell (2014, 5.8).
In the tight end category, MSU gets credit for two NFL draft picks, Deon Sims (2011, 5.8) and interestingly, Mississippi State transfer and first round draft pick, Montez Sweat (2014, 5.3). Again, MSU's evaluation was good here. While that might be unfairly boosting MSU's score a bit, I will point out that MSU's most successful NFL tight end in recent history is actually the undrafted Garrett Celek (2007, 5.1) who was even lower rated in high school.
Finally, in solidly positive territory are MSU's wide receivers. Of the 17 high school wideouts who signed with the Spartans, three of them were eventually drafted: Keshawn Martin (2008, 5.6), B.J. Cunningham (2007, 5.5), and Aaron Burbridge (2012, 5.9). The most notable miss is the legendary bust Fred Smith (2008, 5.9).
In the average category are MSU's running backs and defensive linemen. From 2007 to 2015, MSU signed 12 running back, and two got drafted: Edwin "Rock" Baker (2009, 6.0) and Le'Veon Bell (2010, 5.4). In the defensive end category, MSU has signed 18 in that span, and three wound up being drafted, including MSU's two 5-star recruits: William Gholston (2010, 6.1) and Malik McDowell (2014, 6.1). The other drafted DE was Shilique Calhoun (2011, 5.5). As for defensive tackles, only one of MSU's 11 signed DTs was drafted, 3-star Jerel Worthy (2008, 5.6).
The remaining non-kicker categories where MSU struggles are offensive linemen and linebackers. The o-lineman ranking is not a surprise. I would argue that the combination of unfortunate injuries and a lack of development of offensive lineman talent was the single biggest problem with the offense over the last several years. Over the nine years of this analysis, MSU signed 32 total offensive lineman and only two, Donovan Clark (2011, 5.7) and Brian Allen (2014, 5.8) were drafted. Note that Jack Conklin, as a walk-on, does not count for this analysis. Note also that in the four-star bins (including Brian Allen) MSU's draft rate is pretty much exactly where is should be. It is really the lack of development of the two-star and three-star recruits where MSU has been behind schedule.
As for linebackers, MSU signed a total of 23 between 2007 and 2015, and somehow only one of them, Greg Jones (2007, 5.7) would up being drafted. Looking at the details, MSU has had a lot of successful linebackers, including five players that eventually made NFL teams as free agents (such as Max Bullough and Denicos Allen), and an additional five LBs who were All-Conference Honorees (such as Darien Harris and Chris Norman). But, the lack of NFL draft picks is notable.
As for the rest of the Big Ten, there are a few bright spots here and there. Illinois does well with high school running backs (ranked No. 8 in the Power Five). Nebraska is above average with athletes (No. 4) and defensive tackles (No. 5). Northwestern actually ranks No. 7 for quarterbacks, and even Minnesota has one bright spot: tight ends (No. 9.)
Who Really Is "Linebacker U.?"
To close out this analysis of positions by university, I wanted to present a bit of an awards ceremony for the different position groups. While Penn State likes to anoint themselves as "Linebacker U" (a claim that is certainly "unrivaled") as Figure 7 shows above, the Nittany Lions place only 16th when it comes to putting linebacker recruits into the NFL, relative to expectation. So, which school is the most efficient at identifying and developing linebackers, or running backs, or defensive tackles? Who is the worst? Table 1 below shows the top five and bottom five teams as far as recruiting efficiency for the entire Power Five.
 |
| Table 1: The top and bottom five Universities for each position group at placing recruits into the NFL Draft relative to expectation |
In Table 1, I have highlighted Big Ten teams and Notre Dame. As the table shows the "real" linebacker U. over the past nine complete classes is Alabama, followed by UCLA and LSU. The top half of Table 1 has many of the usual suspects, but there a few surprises. The top three schools for high school quarterbacks turn out to be Iowa, Tennessee, and Baylor. At the running back position, Stanford and rival Cal are in the top two spots. South Carolina makes an appearance in the Top Five at tight end and offensive linemen (a position group led by Oregon and Baylor). The top two schools for defensive ends? Louisville and Arkansas.
As for the Hall of Shame in the bottom half of Table 1, there are not a lot of surprises, based on what we have learned so far. LSU is dead last with quarterbacks. (Sorry Tigers, but in this analysis, Ohio State gets credit for Joe Burrows.) Texas is dead last in three different offensive categories (running back, wide receiver, and offensive linemen). Tennessee, while surprising strong with quarterbacks, is in the bottom five in a shocking six of eleven categories (wide receiver, tight end, defensive end, linebacker, defensive back, and even kickers.)
Finally, while this data is interesting, it is reasonable to ask is these deviations from the averages are statistically significant. When I apply the same binomial test mentioned above to the top five and bottom five list in Table 1, the majority of the results in the top 5 (over 85 percent) are significant to a 95 percent confidence level. All but one result (fifth place in wide receivers) is over 90 percent.
For the bottom five, the confidence levels are not so high. Only eight of the 55 categories are below the 5th percentile. So, there is likely a little more bad luck involved with being in the bottom five than in the top five. That said, the average level of significance in the bottom five for the non-kickers averages about 85 percent. This suggests that in general this effect is real and it is related to coaching skill with certain position groups (either through talent identification or development). Either way, whether the source is coaching skill (or a lack thereof) or just luck, overachieving is still overachieving and underachieving is still underachieving, no matter what the root cause.
A Second Look at Geography
It is interesting to see how different universities perform in with position groups, but another area of curiosity would be to learn if certain geographical areas are more (or less) fertile recruiting grounds for specific types of players. We already know from Part Five that some states (like North Carolina) seem to produce high school football players that make in to the NFL Draft at a higher rate than equally ranked players from other states. But, is that true for all playing groups? Do some states specialize in certain position groups? Fortunately, the data that I have also allows us to examine this question as well.
Let's start once again with an overview of the states by separating offensive and defensive players. This data is shown in Figure 9.
 |
| Figure 9: Breakdown of the recruiting efficiency of offensive and defensive players for each state |
Most of the data points in Figure 9 fall close to a diagonal line stretching from the lower left-hand corner to the upper right-hand corner. Along this line, the draft rate of offensive and defensive players is the same. Pennsylvania falls very close to this line, implying that it is a well-balanced state when it comes to high school talent.
But, there are some interesting deviations. For example, Florida's high draft rates are due almost exclusively due to offensive players. Ohio, South Carolina, and Washington are also stronger with offensive players. North Carolina, however, seems to specialize in players on defense, as does Missouri, Georgia, Michigan and New Jersey. As for the class dunces, Texas and California, Texas has a bigger problem with players on defense, while California, in general, is "less offensive."
It seems reasonable to dig into this issue a little deeper with a closer examination of the same general set of states that we covered in Part Five. Let's start with the three states with the most recruits, namely, Texas, California, and Florida.
 |
| Figure 10: Summary of the number of NFL Draft picks relative to expectation broken down by position group for the states of Texas, California, and Florida. The number above each bar in the national rank for the state for that position group. |
From Part Five, we already know that the draft rate for Florida is significantly better than California and Texas relative to expectation. But, there is clearly a very large difference in performance with different position groups.
Regarding Florida, the Sunshine State is in the top six nationally in six of the eleven categories, including running back, defensive back, kickers (all No. 1), quarterbacks (No. 3), offensive lineman (No. 4), and defensive ends (No. 6.). In contrast, however, Florida also ranks near or at the bottom of the rankings with athletes (No. 62), defensive tackles (No. 61), and linebackers (No. 61). This contrast is quite surprising and certainly would be helpful to know on the recruiting trail. Note that the database contains an additional 11 locations (such as Germany, Australia, and several Canadian Provinces) beyond the 50 US states and D.C. As such, last place is No. 62.
As for California, the state is in last place or close to it and almost all categories. California high school defensive ends are particularly overrated. Wide receiver and tight ends are still negative, but closer to average. Then, there are linebackers, where out of nowhere, California ranks No.1 in the nation. Bizarre.
For Texas, recruits from the Lone Star State underachieve, badly, across the board. That said, there are two small glimmers of hope. Texas high school running backs are above average as a group, and rank No. 10 in the country. Better than that are Texas high school defensive ends, who rank seventh.
Next, let's move to three of the more important state for recruiting in the Southeast: North Carolina, Georgia, and Virginia, as summarized in Figure 11.
 |
| Figure 11: Summary of the number of NFL Draft picks relative to expectation broken down by position group for the states of Georgia, Virginia, and North Carolina. The number above each bar in the national rank for the state for that position group |
As with the universities covered above, there is a surprising amount of variety in the draft rate efficiency of the different playing groups in each state. Overall, North Carolina has the best overall rate, and they place in the top five of five different position groups: running back (No. 3), athletes (No. 3), defensive ends (No. 4), defensive tackles (No. 5) and defensive backs (No. 5.) The Tar Heel State doesn't have a lot of obvious weaknesses, but the ranking for quarterbacks (No. 58) and wide receivers (No. 50) certainly could be better.
As for Georgia, the rankings are more "feast of famine." The clear strength for the Peach State is on the defensive line, where they rank No. 1 overall for both defensive tackles and ends. Tight ends from Georgia (No. 6) are also strong. However, there are three categories specifically which look rather weak: offensive linemen (No. 55), line backers (No. 58) and running backs (No. 60).
Part Five taught us that Virginia was a state that was overrated overall, but which might have some opportunity due to weak competition from in-state schools. Based on Figure 11, that opportunity likely lies with quarterbacks (No. 2 overall), defensive backs (No. 4), athletes (No. 8), and defensive ends (No. 10). On the other hand, it looks like it is best to look elsewhere for running backs, wide receivers, line backers, and defensive tackles.
Finally, let's take a closer look at three Midwest states that should form the foundation of MSU's recruiting efforts: Michigan, Ohio, and Pennsylvania, as shown in Figure 12.
 |
| Figure 12: Summary of the number of NFL Draft picks relative to expectation broken down by position group for the states of Ohio, Pennsylvania, and Michigan. The number above each bar in the national rank for the state for that position group |
As for the state of Ohio, it is also surprisingly a feast or famine situation. Ohio ranks in the top four nationally for quarterbacks (No. 1), offensive linemen (No. 2), defensive tackle (No. 2), and linebackers (No. 4). Ohio is quite average for athletes, wide receivers, and defensive ends and just slightly below average for running backs. In addition, there are two categories where the state of Ohio is noticeably below average, and that is tight ends (No. 61) and defensive backs (No. 61).
As for Pennsylvania, the Keystone State offers an interesting compliment to its neighbor to the West. Pennsylvania ranks No. 2 overall with three position groups: wide receivers, defensive ends, and defensive backs. The state is also above average for high school offensive lineman and linebackers. As for as the type of high school player from Pennsylvania to maybe skip? Athletes.
For Michigan, the Great Lakes State tends to produce high quality athletes (ranked No. 1), defensive tackles (No. 3), and tight ends (No. 4). As for the positions that have under-performed, offensive linemen and linebackers are the biggest problems.
It is worth mentioning that these are also two positions where MSU has struggled to put players into the draft, but it is not just an MSU problem. From 2007 to 2015, a total of 61 linebackers and offensive lineman committed to Power Five schools. Thirty-five of those players attended either Michigan or Michigan State. NONE of the in-state recruits were ever drafted, and of the out-of-state players, only two were ever drafted: Jake Fisher (Class of 2011, OL, 5.7 from Traverse City) an Michael Ojemudia (2015, LB, 5.3 from Farmington). Fisher went to Oregon and Ojemudia went to Iowa.
As a final note here, for a Power Five staff trying to recruit in the Midwest, based on Figure 12 it seems like a good strategy would be to target Ohio for quarterbacks, offensive lineman, linebackers, and defensive tackles, Pennsylvania for wide receivers, defensive ends, defensive backs and maybe running backs, and Michigan for tight ends, athletes, and perhaps also defensive ends.
Is it the University or the State?
In general, it gets a little mind-bending to try to disentangle the effects of Universities, states, and position groups. For example, the state of Michigan is generally weak with linebackers and offensive linemen and MSU shows the same trend. How much do these two factors impact each other? I made an attempt to separate these different variables as shown below in Figure 13.
 |
| Figure 13: Summary of Michigan State's Recruiting Efficiency both in state and out of state |
The left side portion of the graph compares the draft picks relative to expectation (recruiting efficiency) for MSU with in-state players to the efficiency of the state of Michigan as a whole, excluding MSU for each position group. The right side of the graph compares MSU's recruiting efficiency outside the state of Michigan to MSU's overall recruiting efficiency. The number in parenthesis is the portion of recruits that MSU gets from the state of Michigan. For each graph, the general message for each quadrant is noted.
In order to really understand what is happening, it is best to check the location of specific position groups in both graphs. For example, from the left hand figure, there are three position groups in the upper right-hand quadrant, where the in-state talent is strong, as is MSU's use of it: athletes, defensive backs, and tight end.
But, if we then check the right-hand graph, there is clear difference in these three position groups. For the athletes and tight ends, MSU is strong overall, but average out of state. So, MSU is clearly benefiting from having underrated talent nearby that they can mine. However, the story is different for defensive backs. In this case, MSU is strong even out of state. This suggests that MSU does have a specific skill in identifying DB talent, whether in-state or out.
In the upper left-hand corner of the left figure are a cluster of positions where the in-state talent is slightly overrated, but MSU's use of it is above average. This includes wide receivers and quarterbacks. However, if we then check the right-hand graph, the reason for this is also a bit different. For wide receivers, MSU is essentially average out of state. So, MSU is able to find "hidden gems" in state, but not elsewhere. As for quarterbacks, MSU is able to find underrated talent out of state as well. So, this seems like a general strength of MSU recruiting, similar to defensive backs.
Another interesting position is that of defensive tackles. In the state of Michigan, defensive tackles is clearly the most underrated position group. But, MSU is essentially average in both the state of Michigan and overall. The talent is nearby, but for some reason MSU has not been able to get it. It should also be noted that the percentage of DT on MSU's roster from the state is low (14 percent). But, part of this is that the pool of in-state defensive tackles is also small. Only 13 DTs committed to Power Five teams in this span, five of whom were eventually drafted. Incidentally, those five players attended Michigan (two of them), Iowa, LSU, and Ohio State.
Finally, there are two position groups in the lower left hand corner of the left graph where the in-state is weak and MSU's use of it is also weak: offensive linemen and linebackers. However, once again, a check of the right-hand graph gives more context. In this case, MSU success with out-of-state o-linemen is also below average. This is simply a position group where MSU struggles everywhere. However, for linebackers, MSU is average out of state. So, it seems to me that the problem here is more a state of Michigan problem than a Michigan State problem. Perhaps MSU should look more aggressively out-of-state for linebackers, considering almost half of the Spartan's linebacker recruits were Michiganders over the nine-year span of this study.
Where is The Linebacker State?
Finally, similar to the previous wrap-up of the performance of different schools with each position group, it makes sense summary the Hal of Fame and Hall of Shame for each position group. Just as we did above, here is a table of the top five and bottom five states for each position group as measured by the number of draft picks relative to expectation.
 |
| Table 2: The top and bottom five states for each position group at placing recruits into the NFL Draft relative to expectation |
Many of the states highlighted in Figures 10-12 also appear in this table, both in the top and bottom portions. But, there are a couple of other interesting entries. For example, New York state is a good place to find running backs. South Carolina and Arkansas have underrated wide receivers. The places to look for tight ends include Kansas and Washington. Missouri looks good for underrated defensive linemen. As for the Linebacker State, that honor goes to California, followed by Alabama, and Kansas.
As I close out this piece on our favorite positions, our month-long journey down the rabbit hole of MSU and college football recruiting is almost at its end. So, far we have explored stars, MSU's classes, booms and busts, universities, states, and now positions. We have journeyed far and (I hope) learned a lot.
But there is one topic left that we have not yet explored. While high school stars and NFL draft picks are important, there is one crucial metric that has barely been mentioned yet: wins. It seems clear that the teams that recruit at a super elite level (maybe top three to five every year) are the teams that wind up playing in the College Football Playoffs. Can we draw any sort of correlation between historic recruiting success and success on the gridiron? That is a question that I will next in the final installment of this series. Stay tuned.
Comments
Post a Comment